
Analisis Tren (Fig. 1).
Pasangan mata uang EUR/USD bisa bergera naik dari level 1,0784 (menutup candlestick harian hari Jumat) sebesar 1,0821, level pullback 23,6% (garis putus-putus merah). Jika ada pengujian level ini, pergerakan naik yang berlanjut memungkinkan dengan target dari 1,0836, level resistance historis (garis putus-putus biru).
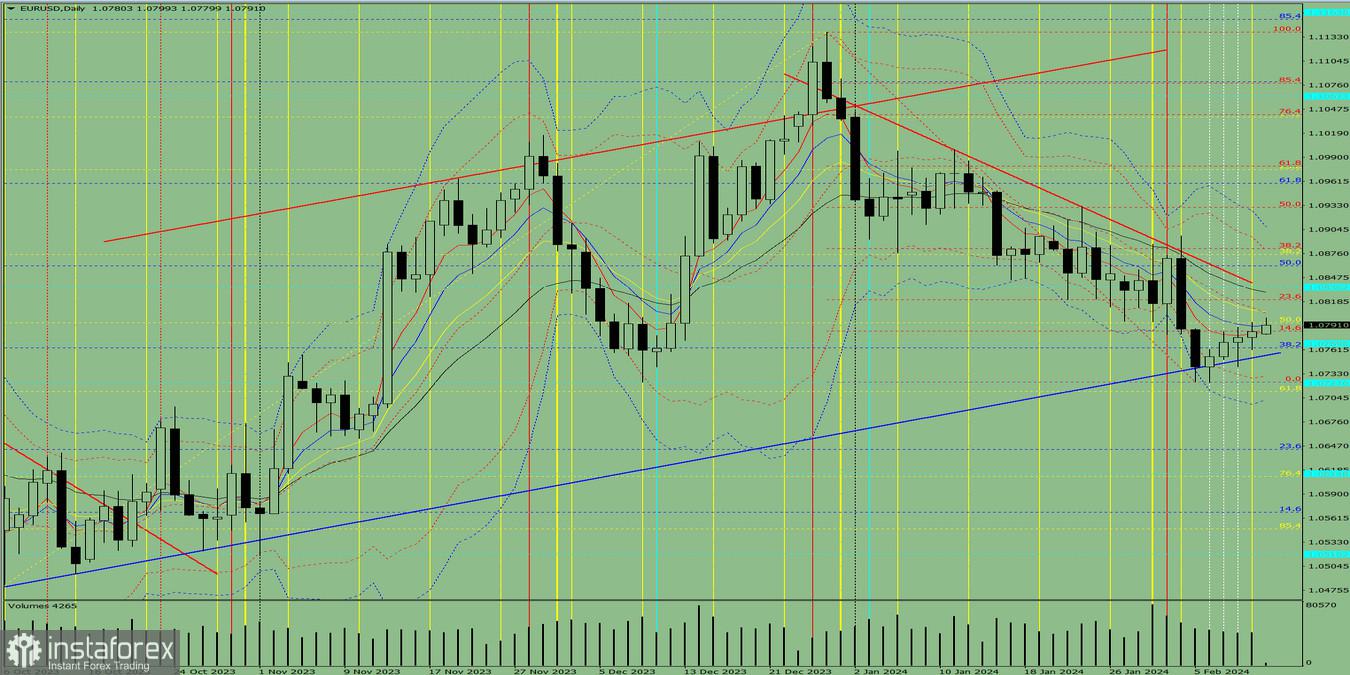
Fig. 1 (grafik harian).
Analisis keseluruhan:
- Analisis indikator – naik;
- Level Fibonacci – naik;
- Volume – naik;
- Analisis Candlestick – naik;
- Analisis Tren – naik;
- Bollinger band – naik;
- Grafik Mingguan – naik.
Hari ini, harga bisa bergera naik dari level 1,0784 (menutup candlestick harian hari Jumat) sebesar 1,0821, level pullback 23,6% (garis putus-putus merah). Jika ada pengujian level ini, pergerakan naik yang berlanjut memungkinkan dengan target dari 1,0836, level resistance historis (garis putus-putus biru).
Secara alternatif, harga-harga bisa bergerak naik dari level 1,0784 (menutup candlestick harian) sebesar 1,0821, level pullback 23,6% (garis putus-putus merah). Jika ada pengujian level ini, pergerakan turun memungkinkan dengan target dari 1,0807, EMA 13 periode (garis tipis kuning).


Hot
No comment on record. Start new comment.