技术分析 – 近期金价呈上升三角形

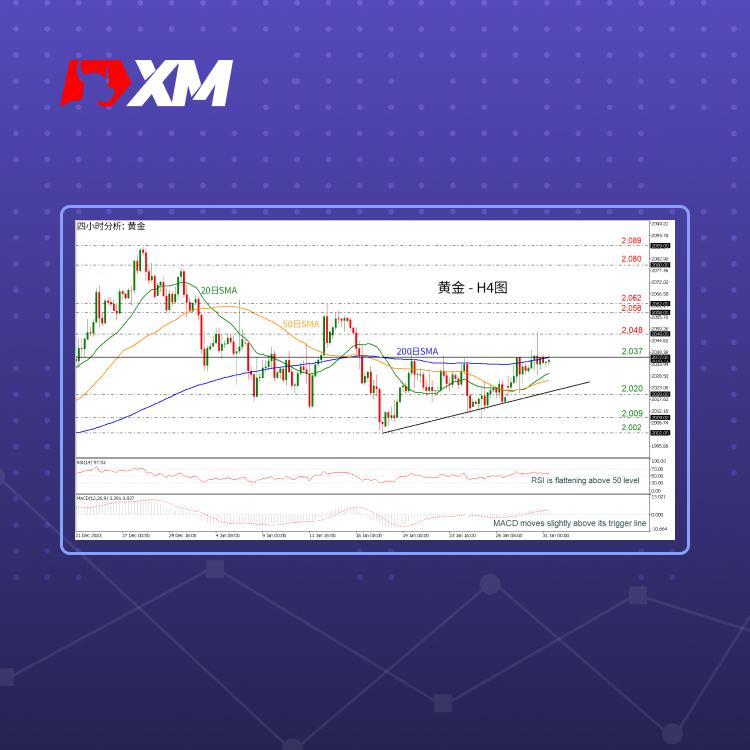
- 金价尝试突破2,037和200日SMA
- RSI和MACD区间震荡
- 短期前景呈中立至看涨
四小时图显示,金价徘徊在前期高点2,037和200日移动平均线(SMA)并形成上升三角形。
技术指标表明,相对强弱指数(RSI)正在50中立水平上方区间震荡,异同移动平均线(MACD)指标维持在看涨区间的红色信号线上方,两者均证实近期价格疲软。
若价格上行,可能尝试突破前期高点2,037并重新测试前期高点2,048。若买盘情绪加剧,中期上升趋势重新发挥作用,则价格或将触及2,058-2,062区间。
然而,若价格反转下行,则位于2,029的20日移动平均线(SMA)和位于2,026的50日移动平均线(SMA)可能相继提供支撑,继续下行,价格或将跌至位于2,023的近期三角形上升线附近。若成功跌破此处,则前期低点2,020和2,009或将提供支撑。
过去两周中期前景已转为中立至看涨,只有收盘强劲突破2,037才能恢复长期看涨趋势。反之,一旦金价大幅跌破前期低点2,002,前景可能转为看跌。
Reprinted from XM,the copyright all reserved by the original author.
Disclaimer: The content above represents only the views of the author or guest. It does not represent any views or positions of FOLLOWME and does not mean that FOLLOWME agrees with its statement or description, nor does it constitute any investment advice. For all actions taken by visitors based on information provided by the FOLLOWME community, the community does not assume any form of liability unless otherwise expressly promised in writing.
FOLLOWME Trading Community Website: https://www.followme.com


Hot
No comment on record. Start new comment.