技术分析 – WTI在中立三角形内区间震荡

- WTI原油期货持续区间震荡
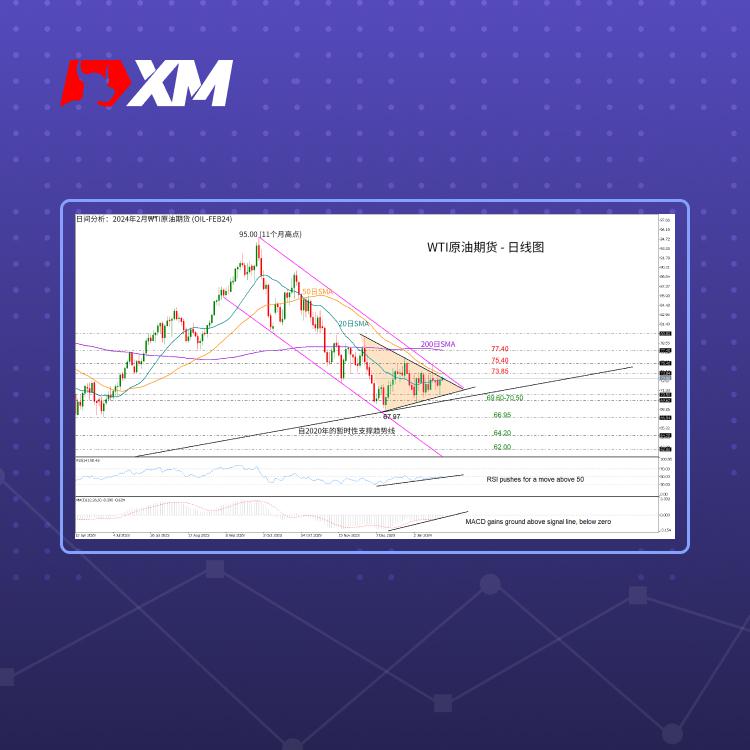
- 阻力位于73.85;支撑位在69.60
WTI原油期货(2月交割)在1月内维持区间震荡,在看跌通道底部形成了中立三角形形态。
鉴于相对强弱指数(RSI)已突破其50中立水平上方,而异同移动平均线(MACD)指标也有所改善,价格或有望看涨突破。
然而,价格需突破一些阻力,前景才有望转为看涨。若油价上涨,下行通道上轨的73.85或形成阻力,该处也是50日移动平均线(SMA)的位置。接着,若突破75.40窄幅区间,将上探位于77.40的200日移动平均线(SMA)。继续上行,或挑战80.00关键水平。
若价格下跌,或会重新测试三角形的下轨70.50和位于69.60的2020年低点暂时性上升趋势线。若未能在该处反弹则可能会强劲下跌,测试5月 – 6月底部66.95。进一步下跌,2023年低点64.20和62.00水平或相继成为支撑。
简而言之,若价格持续在69.60 – 73.85区间震荡,就无法提供下一步走势的明确信号。
Reprinted from XM,the copyright all reserved by the original author.
Disclaimer: The content above represents only the views of the author or guest. It does not represent any views or positions of FOLLOWME and does not mean that FOLLOWME agrees with its statement or description, nor does it constitute any investment advice. For all actions taken by visitors based on information provided by the FOLLOWME community, the community does not assume any form of liability unless otherwise expressly promised in writing.
FOLLOWME Trading Community Website: https://www.followme.com


Hot
No comment on record. Start new comment.