
Analisis tren (Gambar 1).
Pasangan mata uang GBP/USD dapat bergerak naik dari level 1,2551 (penutupan candle harian kemarin) untuk menguji level resistance 1,2582 (garis tebal biru). Setelah itu, pergerakan turun mungkin terjadi untuk menguji level 1,2532, EMA 21 hari (garis hitam tipis). Banyak yang akan bergantung pada berita.Lihat juga: Anda dapat buka akun trading di sini.
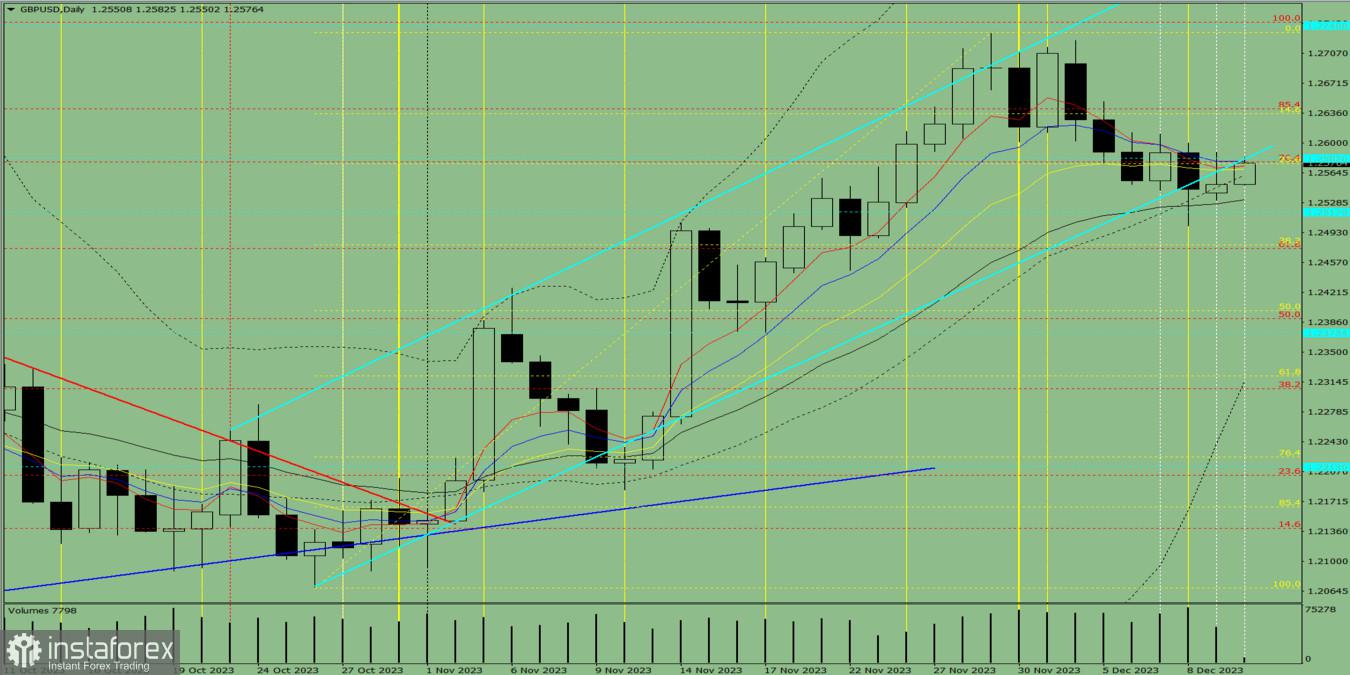
Gambar 1 (grafik harian).
Analisis komprehensif:
- Analisis Indikator – naik;
- Volume – naik;
- Analisis Candlestick – naik;
- Analisis Trend – naik;
- Bollinger bands – naik;
- Grafik mingguan – naik.
Kesimpulan umum: Hari ini, harga dapat bergerak naik dari level 1,2551 (penutupan candle harian kemarin) untuk menguji level resistance 1,2582 (garis tebal biru). Setelah itu, pergerakan turun mungkin terjadi untuk menguji level 1,2532, EMA 21 hari (garis hitam tipis). Banyak yang akan bergantung pada berita.
Secara alternatif, harga dapat bergerak naik dari level 1,2551 (penutupan candle harian kemarin) untuk menguji batas atas di level 1,2611 (candle harian dari 07/12/2023). Setelah mencapai level ini, pergerakan turun mungkin terjadi untuk menguji level 1,2518, level support historis (garis putus-putus biru).


Hot
No comment on record. Start new comment.