AUD/USD slumping back into 0.6600 as Aussie backslides ahead of RBA rate call

- The AUD/USD is down over a full percent in one-sided action on Monday.
- The Aussie has seen Friday’s gains entirely pared away as markets bid up the US Dollar.
- RBA broadly expected to stand pat on rates once more as the Australian economy weakens.
The AUD/USD has steadily fallen on Monday, backsliding a full percent plus extra and paring back last week’s late rally, sending the Aussie (AUD) back towards the 0.6600 handle against the US Dollar (USD).
The Reserve Bank of Australia (RBA) is broadly expected to hold interest rates at 12-year highs of 4.35% for the December rate call, scheduled to be announced at 03:30 GMT.
See More: Australia Interest Rate Decision Preview
Market focus will be on RBA Governor Michele Bullock’s ensuing press conference as investors attempt to glean as much forward guidance out of the RBA’s statements as possible.
The RBA gave an additional 25 basis point rate hike in November as inflation continues to plague the Australian economy, but hampered economic growth and unsteady domestic market pressures are leaving the RBA stuck between a rock and a hard place.
RBA expected to hold at 4.35%
Further rate hikes threaten to further destabilize the Australian economy, and too little action on rates in the face of still-high inflation threatens to exacerbate inflation in a self-fulfilling prophecy cycle of prices running ahead of consumer expectations of further inflation.
With Aussie markets focusing squarely on the RBA, the Aussie central bank’s rate statement will dictate the near-term flows of the AUD, but near-term moves will be quickly capped off heading into the mid-week as investors gear up for 2023’s final US Nonfarm Payrolls print due on Friday.
AUD/USD Technical Outlook
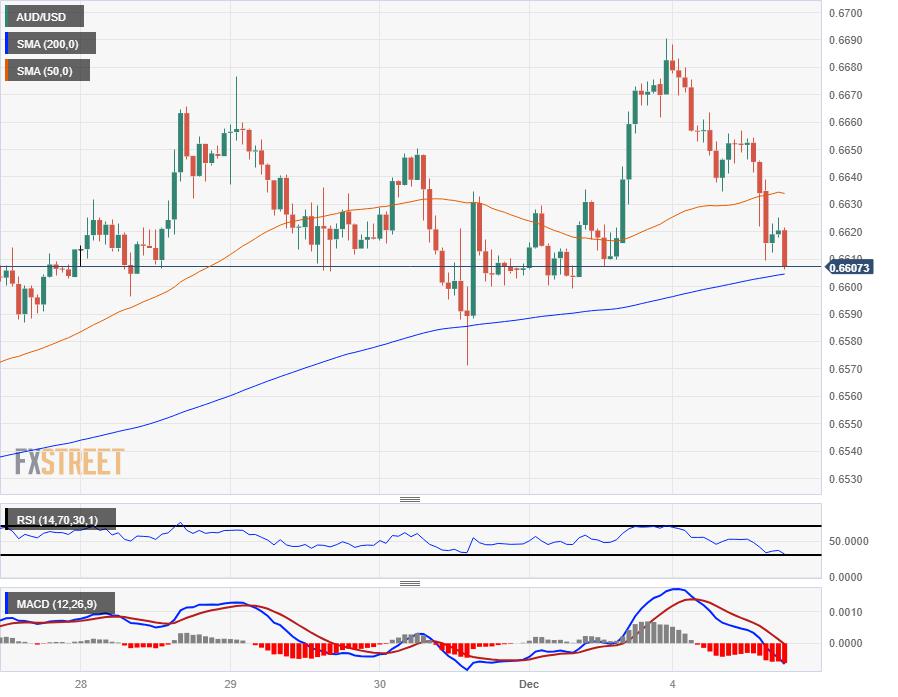
The Aussie’s Monday backslide sees 0.6600 back on the table, wiping away Friday’s bull rally into 0.6690. The AUD/USD’s inability to reclaim the 0.6700 handle is exacerbating downside flows, and the pair is set for an intraday clash with the 200-hour Simple Moving Average (SMA).
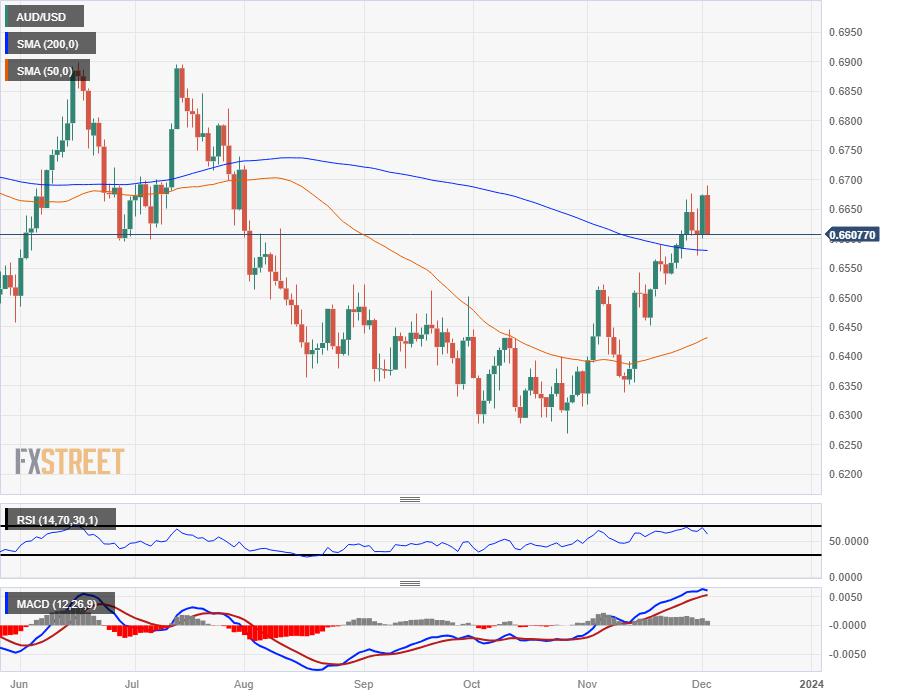
The AUD/USD has seen a bullish recovery in recent weeks, climbing nearly 7% from October’s bottom bids at 0.6270. Further bullish topside is looking limited with prices struggling to develop momentum at the 200-day SMA, but bidders will be looking for an upside continuation if an extended decline sees the pair challenging the 50-day SMA rising into 0.6450.
AUD/USD Hourly Chart
AUD/USD Daily Chart
AUD/USD Technical Levels
Reprinted from FXStreet_id,the copyright all reserved by the original author.
Disclaimer: The content above represents only the views of the author or guest. It does not represent any views or positions of FOLLOWME and does not mean that FOLLOWME agrees with its statement or description, nor does it constitute any investment advice. For all actions taken by visitors based on information provided by the FOLLOWME community, the community does not assume any form of liability unless otherwise expressly promised in writing.
FOLLOWME Trading Community Website: https://www.followme.com


Hot
No comment on record. Start new comment.