EUR/GBP dives to September lows, and indicators flash oversold conditions

- EUR/GBP was seen at 0.856 with a downside movement of 0.70%, it lowest since September
- In the daily and 4-hour chart, indicators hit oversold conditions after a seven-day losing streak
- The cross will also close a 1.40% weekly loss.
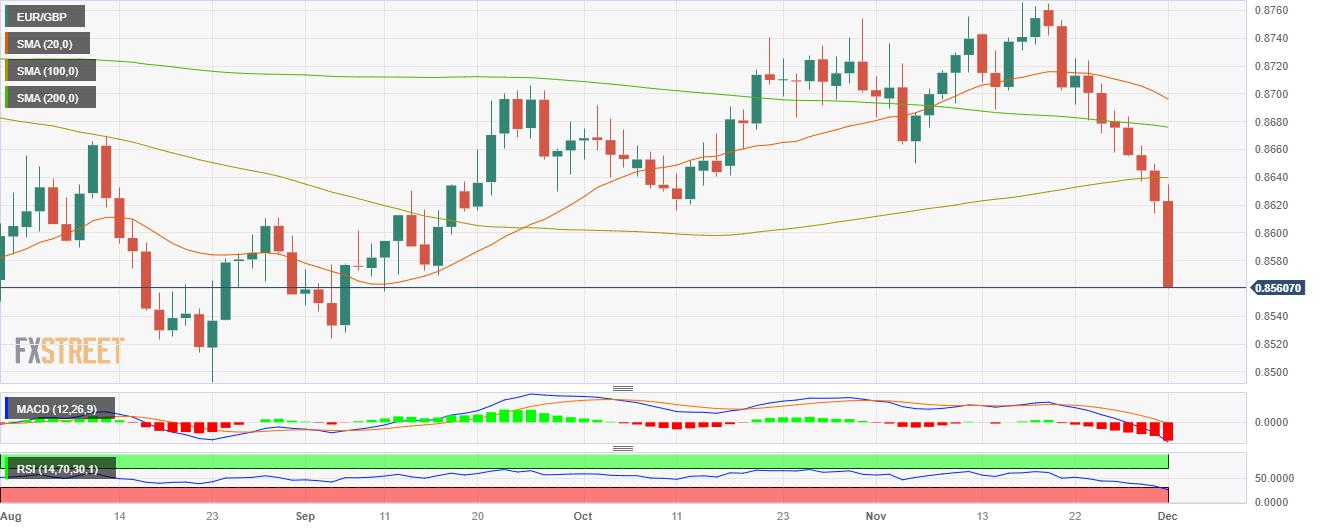
In Friday's session, the EUR/GBP pair was seen at 0.8560 after a downward rally of 0.70%. On the daily and four-hour chart, the cross reached oversold conditions suggesting that an upwards correction may be on the horizon, but the overall trend currently favours the sellers.
The technical indicators on the daily chart are exhibiting robust bearish momentum. The pair's position beneath the 20, 100 and 200-day Simple Moving Averages (SMAs) underscores the dominant downward trend. In addition, the rising red bars of the Moving Average Convergence Divergence (MACD) concur with this downward outlook, reinforcing the influence of bearish pressure while the Relative Strength Index (RSI) is navigated into oversold territory, a sign typically associated with selling saturation which tends to be followed by an upwards correction.
Examining the four-hour chart on the shorter time frame presents similar bearish signals. The pair shows signs of oversold conditions, as evidenced by the Relative Strength Index (RSI). while the Moving Average Convergence Divergence (MACD) prints rising red bars.
Support Levels: 0.8530, 0.8515, 0.8500.
Resistance Levels: 0.8600, 0.8630, 0.8670.
EUR/GBP daily chart
Reprinted from FXStreet_id,the copyright all reserved by the original author.
Disclaimer: The content above represents only the views of the author or guest. It does not represent any views or positions of FOLLOWME and does not mean that FOLLOWME agrees with its statement or description, nor does it constitute any investment advice. For all actions taken by visitors based on information provided by the FOLLOWME community, the community does not assume any form of liability unless otherwise expressly promised in writing.
FOLLOWME Trading Community Website: https://www.followme.com


Hot
No comment on record. Start new comment.