Gold Price Forecast: XAU/USD sees red after US PCE figures, corrects overbought conditions

- The XAU/USD is trading around $2,035 with losses of 0.40%.
- US PCE figures aligned with expectations, while weekly Jobless Claims came in lower than expected.
- US yields and the US Dollar recovered after the data.
In Thursday's session, the XAU/USD is contending with a drop, trading around the $2,035 level following the release of the US's October Personal Consumption Expenditures (PCE) figures which showed no surprises and comes in line with the Federal Reserve’s stance of not calling a victory against inflation too early. In addition, Jobless Claims came in lower than expected.
In that sense, both headline and core expenditures of the Personal Consumption Expenditures (PCE) aligned with expectations, reinforcing the Federal Reserve's stance on inflation that more evidence of disinflation needs to be seen. The headline figure dropped to 3% YoY while the core measure to 3.5% YoY. Furthermore, there was no significant increase in unemployment as seen in the Initial Jobless Claims for the week ending in November 18, coming to 218,000 vs. the 220,000 expected.
In the meantime, the US bond yields are rising. The 2-year rate stands at 4.70%, and the 5 and 10-year yields are seen at 4.29% and 4.30%, respectively, and weight on the Gold’s price as bond rates tend to be seen as the opportunity cost of holding non-yielding metals. The US Dollar also recovered, and the DXY index jumped to 103.35, up by 0.50%.
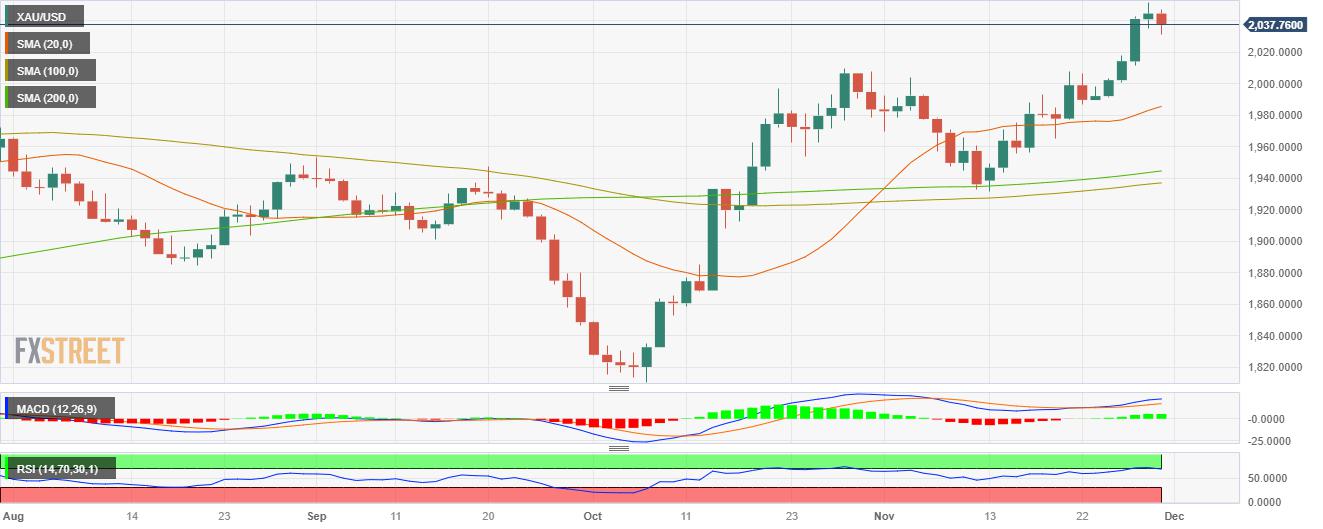
XAU/USD levels to watch
The technical situation on the daily charts suggests that bulls are taking a breather. Despite being in positive territory, a negative slope in the Relative Strength Index (RSI) suggests that the buying momentum is attenuating, and bears are gradually gaining ground after the price hit overbought conditions. The flat red bars observed on the Moving Average Convergence Divergence (MACD) further provide a looming bearish signal, suggesting that the selling pressure might be setting in.
Meanwhile, the placement of the price above the 20,100,200-day Simple Moving Averages (SMAs) reveals a larger bullish framework and the bulls, for now, seem to be taking a breather after the pair hit its highest peak since May at $2,050.
Support Levels: $2,030, $2,015, $2,000.
Resistance Levels: $2040, $2050, $2,070.
XAU/USD daily chart
Reprinted from FXStreet_id,the copyright all reserved by the original author.
Disclaimer: The content above represents only the views of the author or guest. It does not represent any views or positions of FOLLOWME and does not mean that FOLLOWME agrees with its statement or description, nor does it constitute any investment advice. For all actions taken by visitors based on information provided by the FOLLOWME community, the community does not assume any form of liability unless otherwise expressly promised in writing.
FOLLOWME Trading Community Website: https://www.followme.com


Hot
No comment on record. Start new comment.