EUR/USD cracks 1.1000 as US Dollar recedes across the board

- The EUR/USD has clipped a new 15-week high, cracking the 1.1000 major handle on Tuesday.
- Broader markets are rallying in a risk bid across the board, forcing the USD lower.
- Risk assets like the Euro and Gold are rallying into the Tuesday US session.
The EUR/USD has ticked into a fresh 15-week high above the 1.1000 major handle on Tuesday, fueled by a broad-market US Dollar (USD) selloff that is sending the Euro (EUR) higher as investor risk appetite climbs heading into the mid-week.
Fed’s Bowman: I remain willing to support rate hikes if progress on inflation stalls
Markets are shrugging off appearances from central bank policymakers from both sides of the pond. Federal Reserve (Fed) Governor Michelle Bowman hit newswires stating that the Fed is ready to continue increasing rates if progress on inflation stalls.
ECB's President Lagarde: Central bank to discuss QT in the “not too distant future”
Across the Atlantic, European Central Bank (ECB) President Christine Lagarde noted that quantitative tightening could be on the cards for the ECB sooner rather than later. ECB President Lagarde stated that the ECB's governing council could table QT in the "not-too-distant future" as the ECB grapples with European inflation that continues to overshoot ECB targets.
Next Up: EU Sentiment, US GDP
Wednesday sees European Economic Sentiment and Consumer Confidence figures, while the US market will see the next print of US quarterly Gross Domestic Product (GDP) growth.
Markets are forecasting that Pan-EU Consumer Confidence in November will hold steady at -16.9, in-line with October's print.
On the US Side, GDP growth is expected to tick higher from 4.9% to 5.0% for the third quarter.
Euro price today
The table below shows the percentage change of Euro (EUR) against listed major currencies today. Euro was the strongest against the US Dollar.
| USD | EUR | GBP | CAD | AUD | JPY | NZD | CHF |
| USD | -0.39% | -0.52% | -0.30% | -0.64% | -0.62% | -0.57% | -0.39% |
| EUR | 0.38% | -0.15% | 0.09% | -0.26% | -0.23% | -0.19% | 0.01% |
| GBP | 0.52% | 0.14% | 0.24% | -0.11% | -0.09% | -0.05% | 0.17% |
| CAD | 0.29% | -0.10% | -0.23% | -0.36% | -0.32% | -0.29% | -0.09% |
| AUD | 0.64% | 0.25% | 0.11% | 0.35% | 0.02% | 0.07% | 0.30% |
| JPY | 0.62% | 0.23% | 0.11% | 0.34% | -0.01% | 0.04% | 0.26% |
| NZD | 0.56% | 0.20% | 0.05% | 0.28% | -0.07% | -0.05% | 0.22% |
| CHF | 0.37% | -0.01% | -0.16% | 0.08% | -0.28% | -0.26% | -0.20% |
The heat map shows percentage changes of major currencies against each other. The base currency is picked from the left column, while the quote currency is picked from the top row. For example, if you pick the Euro from the left column and move along the horizontal line to the Japanese Yen, the percentage change displayed in the box will represent EUR (base)/JPY (quote).
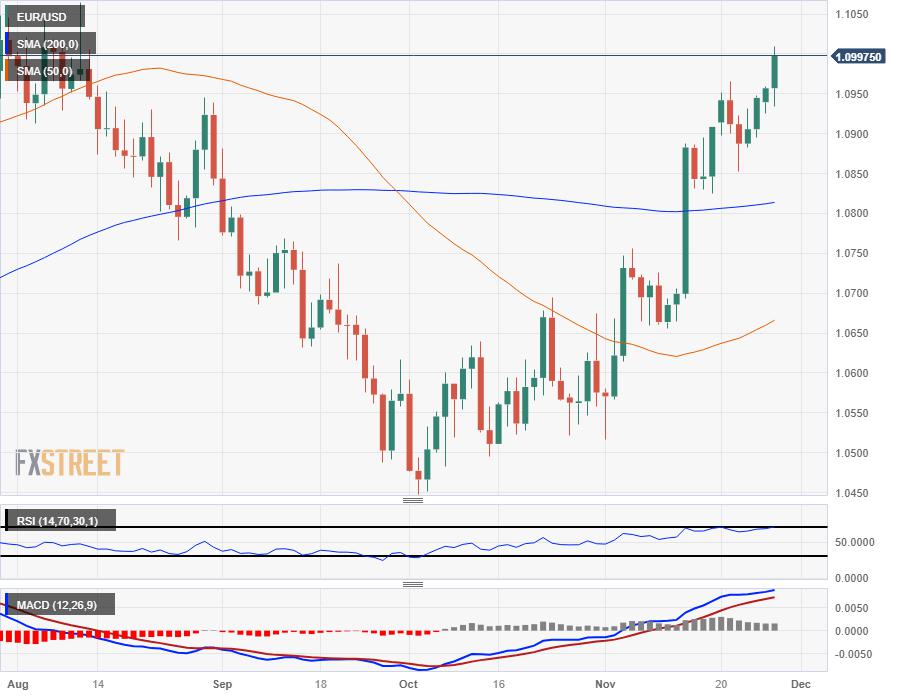
EUR/USD Technical Outlook
The Euro's rally fueled by Greenback-selling across the broader FX marketspace sees the EUR/USD clipping into the 1.1000 handle, climbing four-tenths of a percent with further gains on the cards if market sentiment continues to climb.
The EUR/USD easily broke through the 200-day Simple Moving Average (SMA) in mid-November near the 1.0800 handle, and ongoing EUR bullishness is sending the pair steadily higher as the USD waffles.
The pair has potentially climbed too far, too fast with the 50-day SMA still trading well below prices and in bearish territory, and the moving average is currently rotating towards the topside from just north of 1.0650.
The Relative Strength Index (RSI) is flashing warning signs that the EUR/USD may have gone too far, too quickly with the signal line testing into the overbought boundary line, and the pair could see an extended pullback if bears are able to capitalize on any profit-taking.
EUR/USD Daily Chart
Risk sentiment FAQs
What do the terms"risk-on" and "risk-off" mean when referring to sentiment in financial markets?
In the world of financial jargon the two widely used terms “risk-on” and “risk off'' refer to the level of risk that investors are willing to stomach during the period referenced. In a “risk-on” market, investors are optimistic about the future and more willing to buy risky assets. In a “risk-off” market investors start to ‘play it safe’ because they are worried about the future, and therefore buy less risky assets that are more certain of bringing a return, even if it is relatively modest.
What are the key assets to track to understand risk sentiment dynamics?
Typically, during periods of “risk-on”, stock markets will rise, most commodities – except Gold – will also gain in value, since they benefit from a positive growth outlook. The currencies of nations that are heavy commodity exporters strengthen because of increased demand, and Cryptocurrencies rise. In a “risk-off” market, Bonds go up – especially major government Bonds – Gold shines, and safe-haven currencies such as the Japanese Yen, Swiss Franc and US Dollar all benefit.
Which currencies strengthen when sentiment is "risk-on"?
The Australian Dollar (AUD), the Canadian Dollar (CAD), the New Zealand Dollar (NZD) and minor FX like the Ruble (RUB) and the South African Rand (ZAR), all tend to rise in markets that are “risk-on”. This is because the economies of these currencies are heavily reliant on commodity exports for growth, and commodities tend to rise in price during risk-on periods. This is because investors foresee greater demand for raw materials in the future due to heightened economic activity.
Which currencies strengthen when sentiment is "risk-off"?
The major currencies that tend to rise during periods of “risk-off” are the US Dollar (USD), the Japanese Yen (JPY) and the Swiss Franc (CHF). The US Dollar, because it is the world’s reserve currency, and because in times of crisis investors buy US government debt, which is seen as safe because the largest economy in the world is unlikely to default. The Yen, from increased demand for Japanese government bonds, because a high proportion are held by domestic investors who are unlikely to dump them – even in a crisis. The Swiss Franc, because strict Swiss banking laws offer investors enhanced capital protection.
EUR/USD Technical Levels
Reprinted from FXStreet_id,the copyright all reserved by the original author.
Disclaimer: The content above represents only the views of the author or guest. It does not represent any views or positions of FOLLOWME and does not mean that FOLLOWME agrees with its statement or description, nor does it constitute any investment advice. For all actions taken by visitors based on information provided by the FOLLOWME community, the community does not assume any form of liability unless otherwise expressly promised in writing.
FOLLOWME Trading Community Website: https://www.followme.com


Hot
No comment on record. Start new comment.