AUD/USD climbs into 0.6660 ahead of Australian CPI release

- The Aussie is seeing a boost into new 16-week highs with the Australian CPI due early Wednesday.
- The AUD/USD is seeing a firm rally after rebounding off of 0.6600, and the pair has climbed into 0.6650.
- Aussie bidders are shrugging off Tuesday's Australia Retail Sales miss, dovish RBA Governor Bullock.
The AUD/USD has kicked into a 16-week high twice on Tuesday, climbing into 0.6632 early in the session despite a downside print in Australian Retail Sales. The Aussie (AUD) waffled back into the 0.6600 handle against the US Dollar (USD) before markets again rallied the AUD/USD into 0.6660.
Australian October Retail Sales came in below expectations, printing at -0.2% versus the forecast 0.1% improvement, a steeper decline from September's 0.9% increase.
Reserve Bank of Australia (RBA) Governor Michele Bullock also hit newswires early Tuesday, noting that Australia's inflation outlook looks similar to countries overseas.
Governor Bullock also noted that the RBA has been on the cautious side on rate hikes, but stating that monetary policy remains restrictive and that rate hikes have dampened demand, blaming second-round inflation on high immigration.
RBA’s Bullock: Australian inflation path similar to overseas
Australian Monthly Consumer Price Index (CPI) figures for the year into October are due early Wednesday, and markets are expecting a slight decline of headline CPI inflation to 5.2% from September's 5.6%.
Later Wednesday could see markets hit some turbulence when US Gross Domestic Product (GDPO) figures land during the US market session. US GDP for the third quarter is expected to tick upward from 4.9% to an even 5.0%.
AUD/USD Technical Outlook
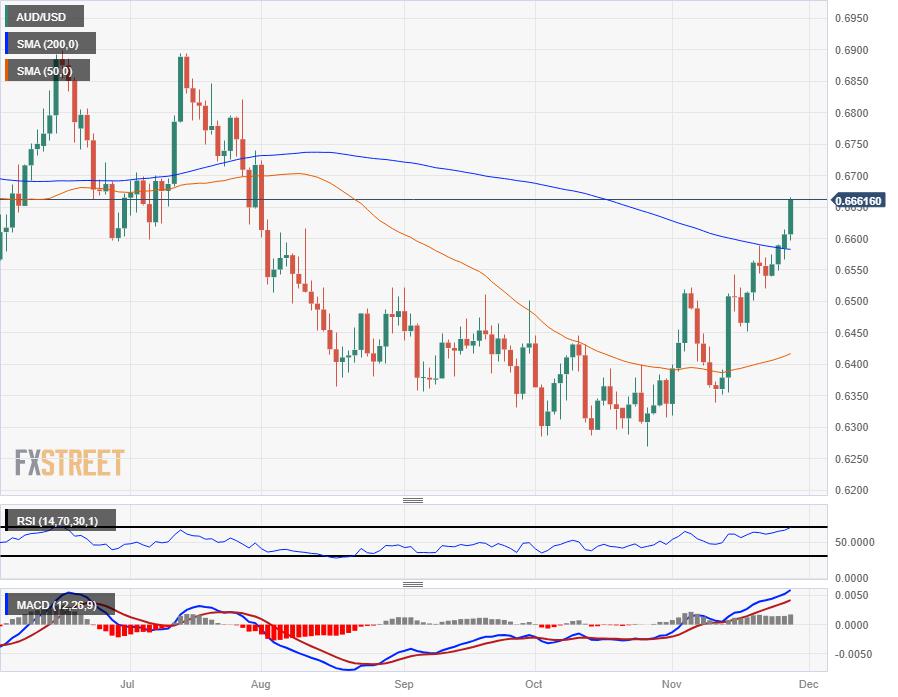
The Aussie's Tuesday rally brings the AUD/USD up over 0.6660, a 16-week high as the AUD shrugs off any bearish sentiment and plows higher against the USD.
The AUD/USD is up three-quarters of a percent from Tuesday's opening bids and the Aussie remains the only major currency that is in the green against all other major currencies on the board.
Tuesday's rally sees the pair easily extending beyond the 200-day Simple Moving Average (SMA), and the long-term trend moving average is set to begin acting as technical support from just beneath 0.6600 if bullish momentum takes a breather.
A pullback represents a very real risk of the pair collapsing back into the midrange near the 50-day SMA at 0.6425. Bullish breaks of the 200-day SMA have proven to be volatile, but short-lived in 2023, and with the RBNA firmly hobbled in place on rates it's difficult to see the Aussie maintaining bullish momentum without external support.
AUD/USD Daily Chart
AUD/USD Technical Levels
Reprinted from FXStreet_id,the copyright all reserved by the original author.
Disclaimer: The content above represents only the views of the author or guest. It does not represent any views or positions of FOLLOWME and does not mean that FOLLOWME agrees with its statement or description, nor does it constitute any investment advice. For all actions taken by visitors based on information provided by the FOLLOWME community, the community does not assume any form of liability unless otherwise expressly promised in writing.
FOLLOWME Trading Community Website: https://www.followme.com


Hot
No comment on record. Start new comment.