AUD/NZD Price Analysis: Aussie rising into technical resistance directly above 1.0840

- The AUD/NZD pair continues to grind into heavy congestion, trapped near long-term midranges.
- Intraday action on the AUD/NZD is leaning towards the downside as the pair sees a mild bearish drift.
- The 200-day SMA is proving too strong a magnet for the AUD/NZD to pull away from.
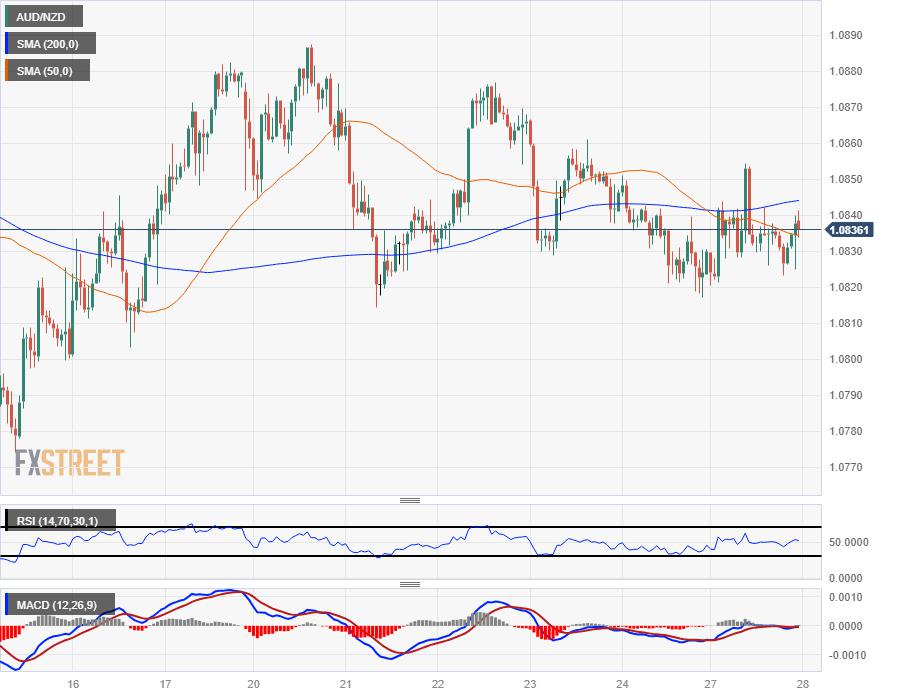
The AUD/NZD is up for the week after climbing a scant one-tenth of a percent on Monday, but bullish momentum remains constrained on the hourly chart by the 200-hour Simple Moving Average (SMA) and a lower-highs pattern on the intraday charts from last week's peak at 1.0887.
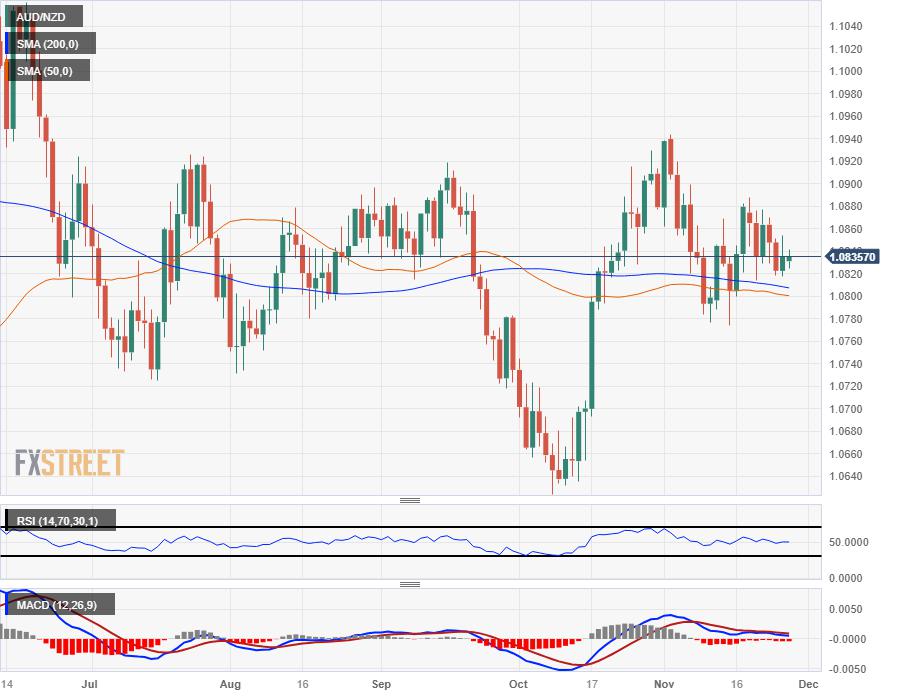
The Aussie (AUD) tipped into a fresh low near 1.0820 against the Kiwi (NZD) late last Friday, and Monday's action saw the pair clawing back losses, but topside momentum remains limited. The pair is catching technical support from the 200-day SMA drifting towards 1.0800, with the 50-day SMA drifting lower in tandem with the longer moving average.
Near-term directional momentum has fully evaporated out of the pair as technical indicators drift into their midranges. The Relative Strength Index (RSI) is flatlining near the 50.0 level, and the Moving Average Convergence-Divergence (MACD) is seeing the fast and slow moving averages waffle into the middle histogram.
Australian Dollar price this week
The table below shows the percentage change of Australian Dollar (AUD) against listed major currencies this week. Australian Dollar was the strongest against the US Dollar.
| USD | EUR | GBP | CAD | AUD | JPY | NZD | CHF |
| USD | -0.14% | -0.24% | -0.12% | -0.39% | -0.67% | -0.32% | -0.23% |
| EUR | 0.15% | -0.09% | 0.03% | -0.22% | -0.51% | -0.17% | -0.09% |
| GBP | 0.24% | 0.10% | 0.09% | -0.15% | -0.45% | -0.10% | -0.01% |
| CAD | 0.12% | -0.02% | -0.12% | -0.25% | -0.56% | -0.20% | -0.11% |
| AUD | 0.38% | 0.24% | 0.13% | 0.26% | -0.30% | 0.06% | 0.15% |
| JPY | 0.66% | 0.52% | 0.36% | 0.54% | 0.29% | 0.34% | 0.43% |
| NZD | 0.32% | 0.18% | 0.08% | 0.22% | -0.05% | -0.35% | 0.10% |
| CHF | 0.24% | 0.10% | 0.00% | 0.12% | -0.13% | -0.43% | -0.08% |
The heat map shows percentage changes of major currencies against each other. The base currency is picked from the left column, while the quote currency is picked from the top row. For example, if you pick the Euro from the left column and move along the horizontal line to the Japanese Yen, the percentage change displayed in the box will represent EUR (base)/JPY (quote).
AUD/NZD Hourly Chart
AUD/NZD Daily Chart
AUD/NZD Technical Levels
Reprinted from FXStreet_id,the copyright all reserved by the original author.
Disclaimer: The content above represents only the views of the author or guest. It does not represent any views or positions of FOLLOWME and does not mean that FOLLOWME agrees with its statement or description, nor does it constitute any investment advice. For all actions taken by visitors based on information provided by the FOLLOWME community, the community does not assume any form of liability unless otherwise expressly promised in writing.
FOLLOWME Trading Community Website: https://www.followme.com


Hot
No comment on record. Start new comment.