EUR/USD Price Analysis: Continues the winning streak on weaker US Dollar, trades near 1.0950

- EUR/USD extends gains for the third session as the US Dollar struggles.
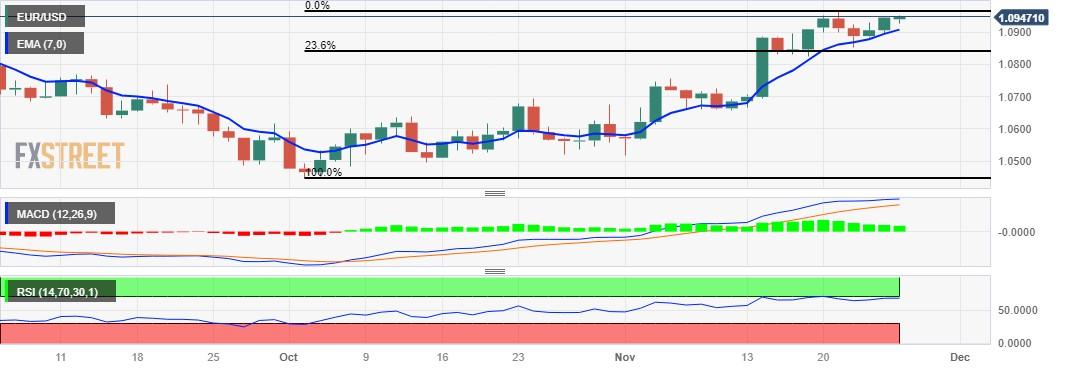
- Technical indicators suggest a potential revisit to a three-month high at 1.0965.
- The seven-day EMA could act as a key support followed by the psychological level at 1.0900.
EUR/USD continues the winning streak, hovering below the psychological level at the 1.0950 level during the Asian session on Monday. The Euro receives upward support, which could be attributed to the weaker US Dollar (USD) following the mixed US S&P Global PMI data.
US S&P Global Composite PMI for November remained unchanged at 50.7. The Services PMI improved to 50.8 in November from 50.6 prior. However, the Manufacturing PMI decreased to 49.4 from 50.0.
The technical signals for the EUR/USD pair are in favor of the ongoing upward movement. With the 14-day Relative Strength Index (RSI) staying above the 50 mark, there's a bullish sentiment suggesting a potential revisit to the three-month high at 1.0965.
If the pair manages to break through that level, it could empower EUR/USD bulls to tackle the resistance zone near the psychological level of 1.1000.
Additionally, the Moving Average Convergence Divergence (MACD) line sits above both the centerline and the signal line, supporting for a bullish momentum for the pair.
On the downside, the seven-day Exponential Moving Average (EMA) at 1.0908 appears to be the key support level aligned with the psychological support at 1.0900 level. A break below the level could push the EUR/USD pair to visit the next support region around 1.0850 lined up with the 23.6% Fibonacci retracement at 1.0840.
EUR/USD: Daily Chart
Reprinted from FXStreet_id,the copyright all reserved by the original author.
Disclaimer: The content above represents only the views of the author or guest. It does not represent any views or positions of FOLLOWME and does not mean that FOLLOWME agrees with its statement or description, nor does it constitute any investment advice. For all actions taken by visitors based on information provided by the FOLLOWME community, the community does not assume any form of liability unless otherwise expressly promised in writing.
FOLLOWME Trading Community Website: https://www.followme.com


Hot
No comment on record. Start new comment.