GBP/JPY Price Analysis: Extends rally to three days, traders eye 188.00

- GBP/JPY climbs for the third consecutive day, supported by strong UK economic indicators and subdued trading activity.
- GBP/JPY's recovery from a three-week low, propels the pair above 187.00 with potential target at 188.00.
- Downside risks remain, with immediate support at Tenkan-Sen (186.37); a drop below 187.00 could lead to further declines.
The Pound Sterling (GBP) continued to rally for the third straight day against the Japanese yen (JPY) on Thursday, courtesy of goodish economic data from the UK. That, alongside thin liquidity conditions due to Japan and the US being on holiday, keeps GBP buyers in charge. At the time of writing the GBP/JPY is trading at 187.50.
European equities portrayed an upbeat market mood. S&P Global revealed that business activity in the UK picked up, after printing three months of contraction. Nevertheless, the Manufacturing PMI index shrunk for the sixth consecutive month, though it approaches the 50 expansion/contraction threshold.
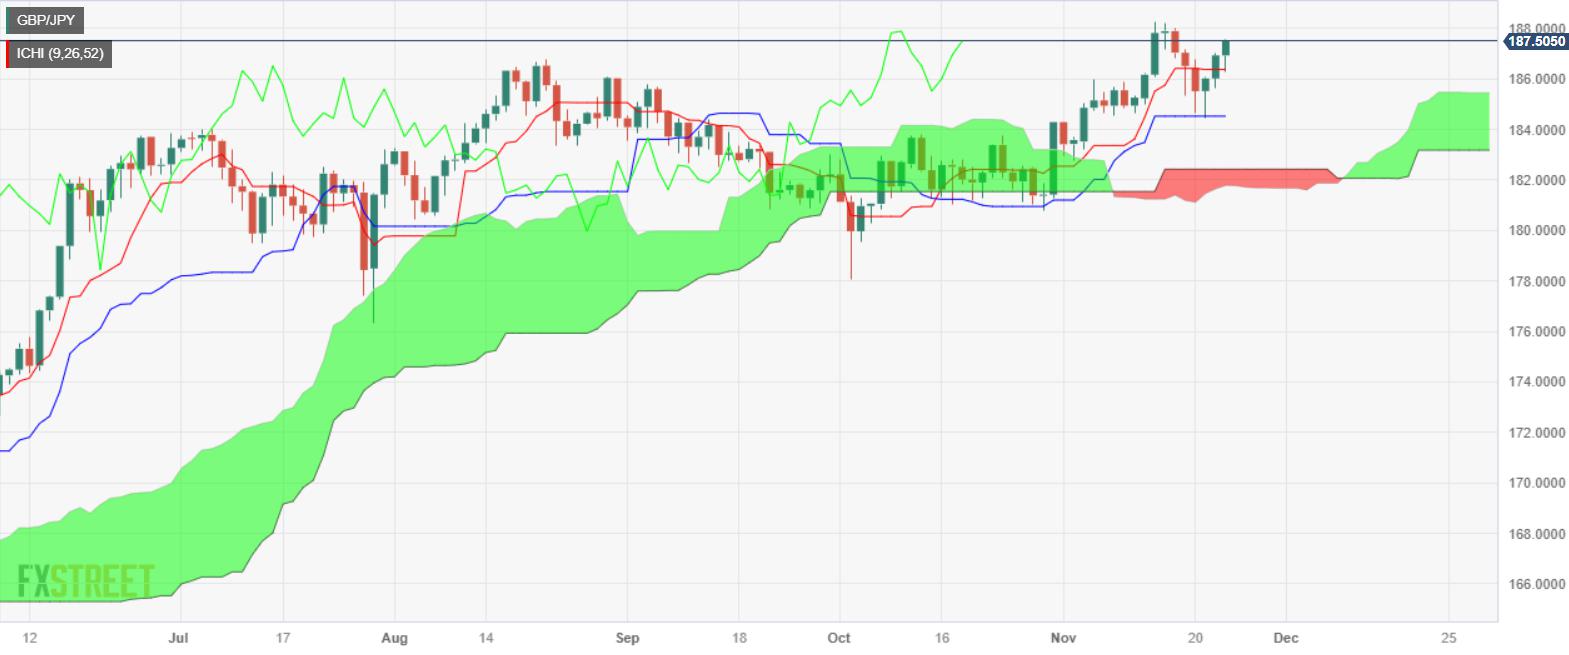
From a technical standpoint, the GBP/JPY recovered after diving to a three-week low at 184.46, as shown by the daily chart. Buyers stepped in as the price bounced at the Kijun-Sen at 184.52 and broke on its way north the Tenkan-Sen at 186.37. For a bullish continuation, the pair must reclaim the 188.00 figure, followed by the year-to-date (YTD) high at 188.28. to cement the uptrend toward the 190.00 mark.
On the other hand, if GBP/JPY drops below 187.00, the first support would be the Tenkan-Sen at 186.37, before sliding toward the 186.00 figure. Downside risks remain below that level, with next support at the Senkou Span A at 185.44.
GBP/JPY Price Analysis – Daily Chart
GBP/JPY Technical Levels
Reprinted from FXStreet_id,the copyright all reserved by the original author.
Disclaimer: The content above represents only the views of the author or guest. It does not represent any views or positions of FOLLOWME and does not mean that FOLLOWME agrees with its statement or description, nor does it constitute any investment advice. For all actions taken by visitors based on information provided by the FOLLOWME community, the community does not assume any form of liability unless otherwise expressly promised in writing.
FOLLOWME Trading Community Website: https://www.followme.com


Hot
No comment on record. Start new comment.