GBP/USD Price Analysis: Aims to revisit two-month highs, hovers above 1.2500

- GBP/USD moves above the 1.2500 level while recovering recent losses.
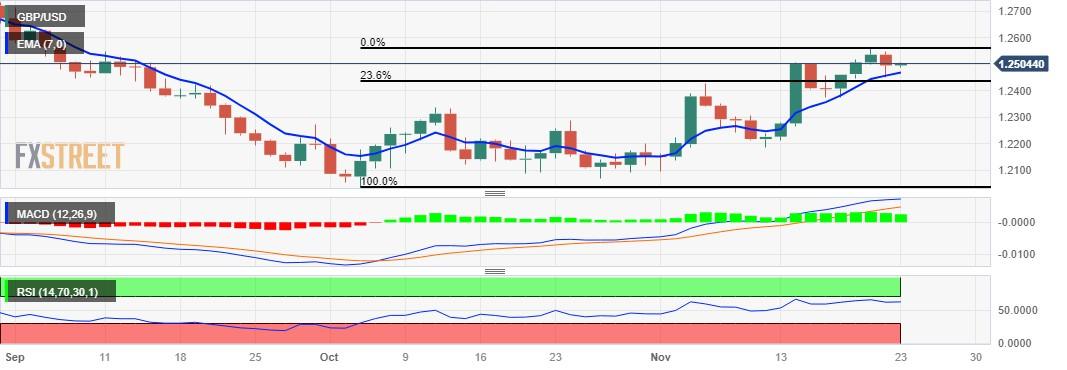
- The pair's bulls could explore the 1.2550 major barrier as technical indicators suggest strong momentum.
- Seven-day EMA appears as a key support aligned with the 1.2450 major level near to the weekly low.
GBP/USD retraces recent losses registered in the previous session, trading higher around 1.2500 psychological level during the Asian session on Thursday.
The technical indicators for the GBP/USD pair are signaling a bullish outlook. The 14-day Relative Strength Index (RSI) above the 50 level indicates upward support, suggesting a bullish momentum in favor of the pair.
Additionally, the Moving Average Convergence Divergence (MACD) line, positioned above the centerline and exhibiting divergence above the signal line, implies a strong momentum in the GBP/USD pair.
The GBP/USD could face a challenge around the region at a major level of 1.2550, nearing a two-month high at 1.2559 level. A firm breakthrough above the latter could inspire the bulls of the pair to test the 1.2600 psychological level.
The US Dollar (USD) could improve as investors seem to perceive persistent inflation in the United States (US) following US economic data, which could put pressure on the GBP/USD pair. The seven-day Exponential Moving Average (EMA) at 1.2469 could act as a key support aligned with the 1.2450 major level and the weekly low at 1.2446.
A decisive break below the support region could push the GBP/USD pair to navigate the next support area around the 23.6% Fibonacci retracement at 1.2436 followed by the 1.2400 psychological level.
GBP/USD: Daily Chart
Reprinted from FXStreet_id,the copyright all reserved by the original author.
Disclaimer: The content above represents only the views of the author or guest. It does not represent any views or positions of FOLLOWME and does not mean that FOLLOWME agrees with its statement or description, nor does it constitute any investment advice. For all actions taken by visitors based on information provided by the FOLLOWME community, the community does not assume any form of liability unless otherwise expressly promised in writing.
FOLLOWME Trading Community Website: https://www.followme.com


Hot
No comment on record. Start new comment.