EUR/USD Price Analysis: Holds above 1.0900 ahead of the Eurozone PMI data

- EUR/USD climbs above the 1.0900 mark on Thursday ahead of the Eurozone PMI data.
- The bullish outlook of EUR/USD remains intact as the major pair holds above the 50- and 100-hour EMA.
- The first resistance level is seen at 1.0965; 1.0870 acts as an initial support level for the pair.
The EUR/USD pair snaps its two-day losing streak and surges above 1.0900 during the Asian session on Thursday. Traders will closely monitor the Eurozone preliminary PMI data and the minutes of the ECB on Thursday. The markets remain subdued due to the Thanksgiving day holiday in the US on Thursday. The major pair currently trades around 1.0905, up 0.16% on the day.
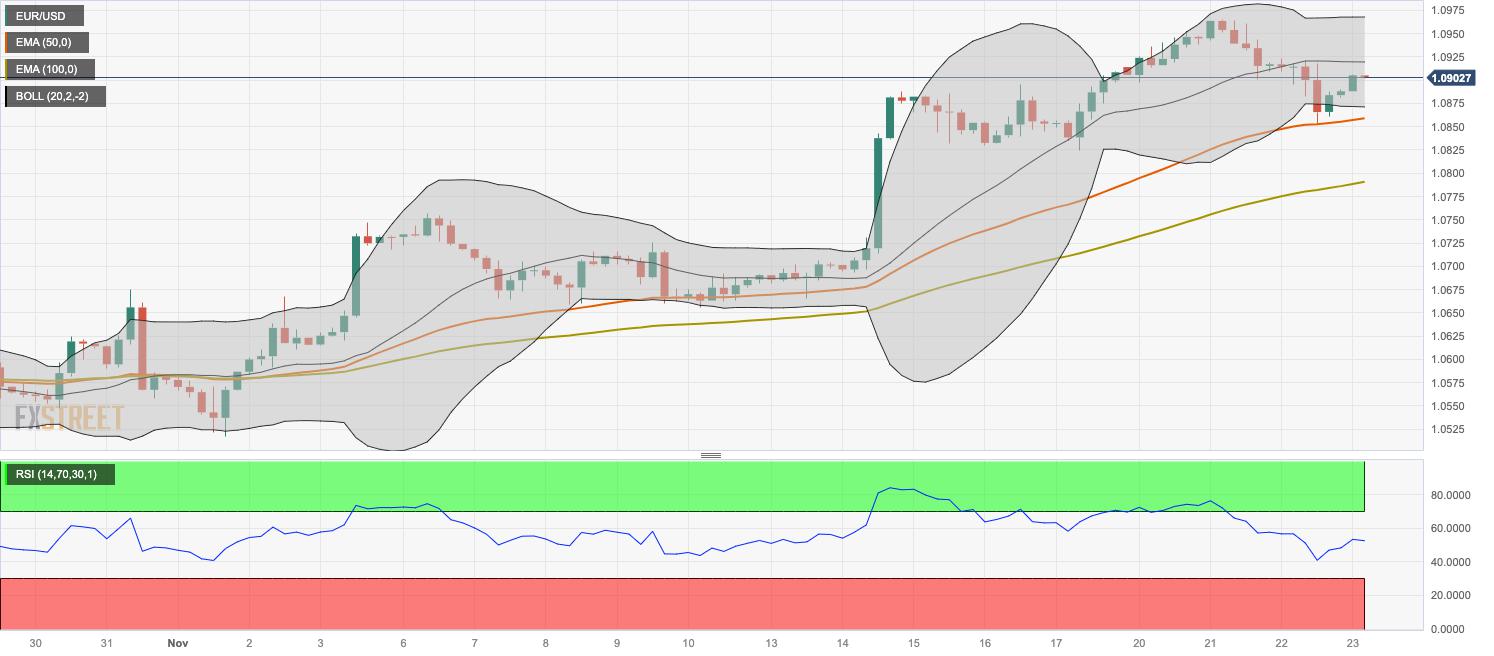
From a technical perspective, the bullish potential of EUR/USD remains intact as the major pair holds above the 50- and 100-hour Exponential Moving Averages (EMA) on the four-hour chart. Additionally, the Relative Strength Index (RSI) stands in bullish territory above 50, which supports the buyers for the time being.
The first upside barrier for EUR/USD is seen at 1.0965, representing the confluence of the upper boundary of the Bollinger Band and a high of November 21. The key resistance level will emerge near a psychological round figure and a high of August 11 at 1.1000. A decisive break above the latter will see the rally to a high of August 4 at 1.1042, en route to a high of July 27 at 1.1149.
On the flip side, the lower limit of the Bollinger Band at 1.0870 acts as an initial support level for the major pair. The additional downside filter to watch is near the 50-hour EMA and a low of November 22 at the 1.0850-1.0860 zone. Further south, the next contention level is located at the 100-hour EMA at 1.0790. A breach of the latter will see a drop to a high of November 9 at 1.0725.
EUR/USD four-hour chart
Reprinted from FXStreet_id,the copyright all reserved by the original author.
Disclaimer: The content above represents only the views of the author or guest. It does not represent any views or positions of FOLLOWME and does not mean that FOLLOWME agrees with its statement or description, nor does it constitute any investment advice. For all actions taken by visitors based on information provided by the FOLLOWME community, the community does not assume any form of liability unless otherwise expressly promised in writing.
FOLLOWME Trading Community Website: https://www.followme.com


Hot
No comment on record. Start new comment.