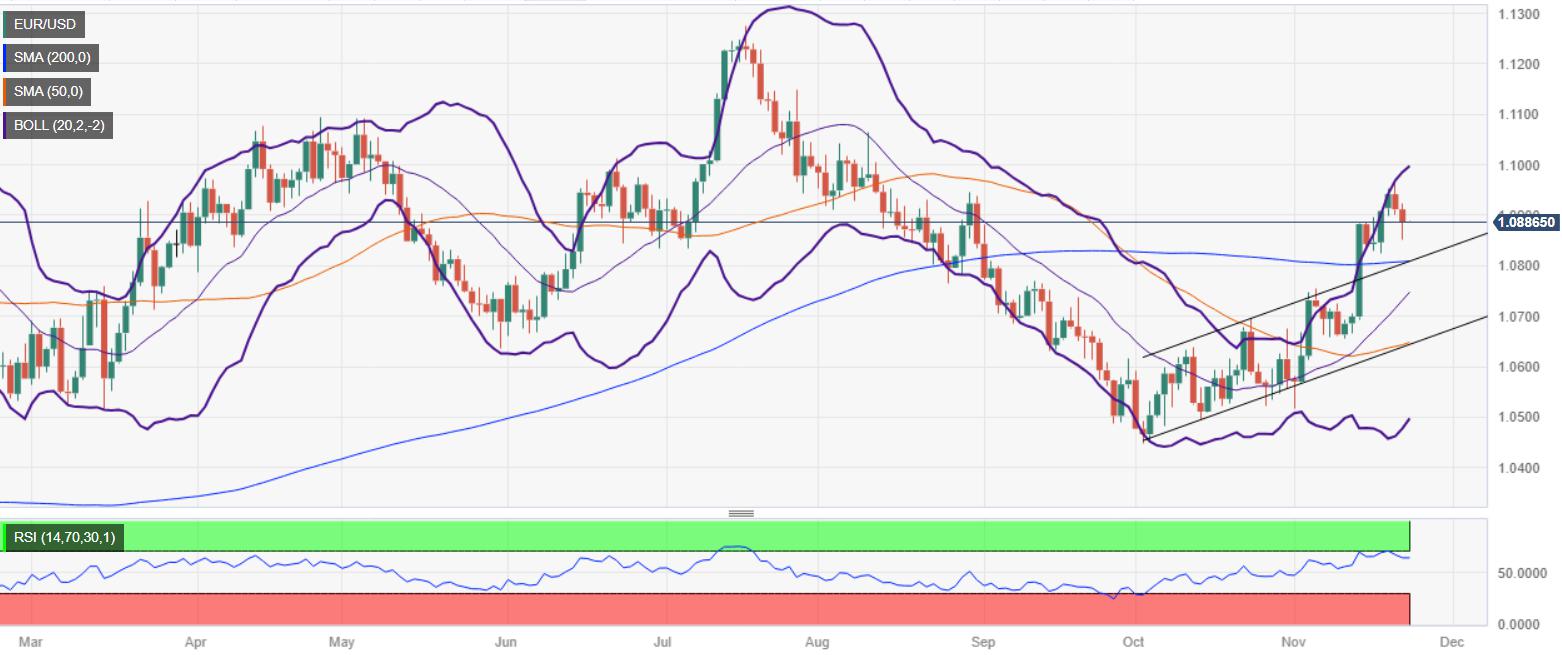
EUR/USD Price Analysis: Dips below 1.0900, though retains bullish bias on daily chart

- EUR/USD is bullish despite falling to a three-day low.
- The daily chart portrays the formation of a bullish hammer, which could pave the way to challenge 1.1000.
- A bearish resumption would happen if EUR/USD stays below 1.0900.
The Euro (EUR) dropped to a three-day low against the US Dollar (USD), though it remains bullish according to the daily chart, as Wednesday’s price action formed a ‘hammer’ preceded by a downtrend. Although it warrants further upside is expected, the break of crucial resistance levels must be achieved to extend the rally. The EUR/USD trades at 1.0884, down 0.03%.
To cement the uptrend, EUR/USD buyers need to reclaim the 1.0900 figure. Once done, the next resistance level would be the November 21 swing high at 1.0965, followed by the 1.1000 figure. A breach of the latter would expose the August 10 high at 1.1065.
Conversely, if EUR/USD stays below 1.0900 and extends its losses past the November 22 low of 1.0852, that could exacerbate the pair’s drop to challenge the 200-day moving average (DMA) at 1.0808. If buyers surrender the latter, the major would fall toward the 1.0700 mark.
EUR/USD Price Analysis – Daily Chart
EUR/USD Technical Levels
Reprinted from FXStreet_id,the copyright all reserved by the original author.
Disclaimer: The content above represents only the views of the author or guest. It does not represent any views or positions of FOLLOWME and does not mean that FOLLOWME agrees with its statement or description, nor does it constitute any investment advice. For all actions taken by visitors based on information provided by the FOLLOWME community, the community does not assume any form of liability unless otherwise expressly promised in writing.
FOLLOWME Trading Community Website: https://www.followme.com


Hot
No comment on record. Start new comment.