USD/CHF Price Analysis: Maintains position above 0.8850, barrier at nine-day EMA

- USD/CHF halts a losing streak on the likelihood of further policy tightening by the Fed.
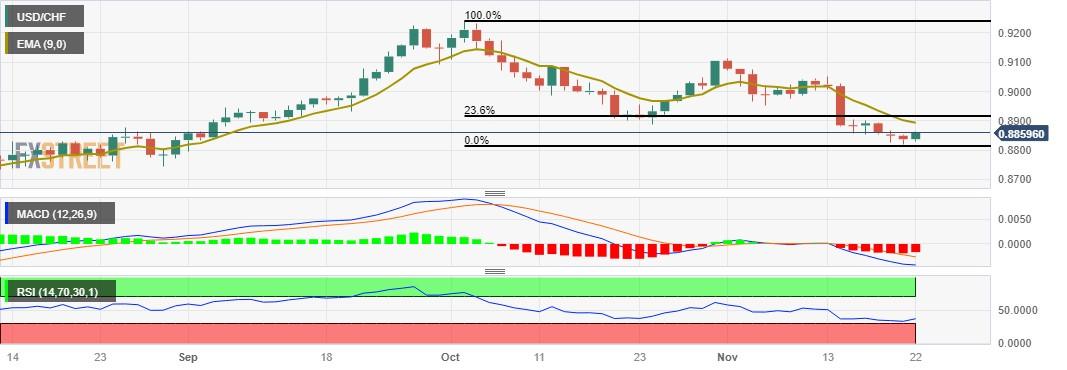
- Nine-day EMA appears as the key barrier followed by the 0.8900 psychological level.
- A break below the 0.8850 level could push the pair toward three-month lows.
USD/CHF snaps a three-day losing streak, edging higher near 0.8860 during the European session on Wednesday. The nine-day Exponential Moving Average (EMA) at 0.8892 emerges as the resistance aligned up with the psychological region at the 0.8900 level.
A breakthrough above the latter could open the doors for the USD/CHF pair to explore the next barrier around the 23.6% Fibonacci retracement at 0.8913 followed by the 0.8950 major level.
The Federal Open Market Committee (FOMC) meeting minutes on Tuesday suggested that additional monetary policy tightening may be necessary if new data does not reach the Federal Reserve's (Fed) inflation target, which may be the reason why the USD/CHF pair has gained strength. Until there is evident and consistent progress toward the Committee's inflation target, the Board resolved to stick to its strict stance.
However, the technical indicators for the USD/CHF pair support the current downward trend. The 14-day Relative Strength Index (RSI) below 50 indicates bearish sentiment, indicating that the pair is losing momentum.
Furthermore, the Moving Average Convergence Divergence (MACD) line is below the centerline, with divergence below the signal line, indicating that the USD/CHF pair could re-test the major support at the 0.8850 level. If there is a break below the level, the pair could navigate the area around the psychological level at 0.8800, nearing the three-month low at 0.8795.
USD/CHF: Daily Chart
Reprinted from FXStreet_id,the copyright all reserved by the original author.
Disclaimer: The content above represents only the views of the author or guest. It does not represent any views or positions of FOLLOWME and does not mean that FOLLOWME agrees with its statement or description, nor does it constitute any investment advice. For all actions taken by visitors based on information provided by the FOLLOWME community, the community does not assume any form of liability unless otherwise expressly promised in writing.
FOLLOWME Trading Community Website: https://www.followme.com


Hot
No comment on record. Start new comment.