USD/JPY Price Analysis: Drops to an eight-week low, hovers around 147.50

- USD/JPY moves on the downward trajectory to an eight-week low.
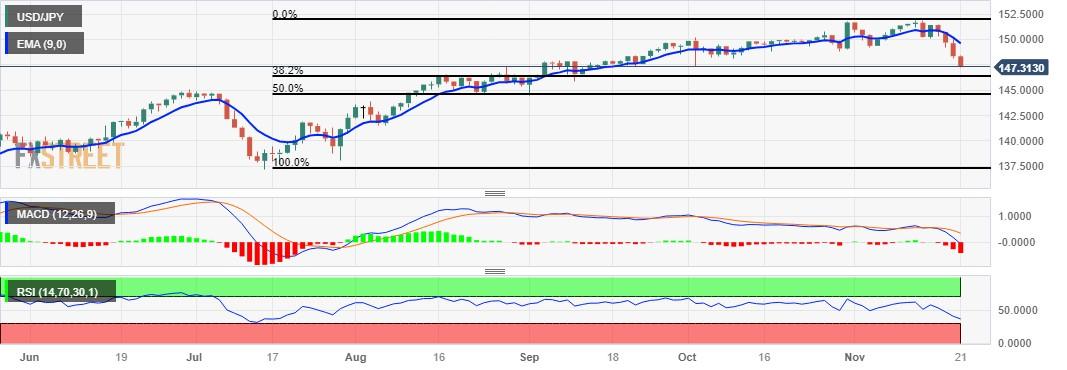
- 147.00 psychological level appears to be a key support following the 38.2% Fibonacci retracement.
- A breakthrough above the 148.00 level could support the pair to explore the region near the nine-day EMA.
USD/JPY extended the losing streak that began on Thursday and marked an eight-week low, trading around 147.40 during the European session on Tuesday. The 147.00 psychological level emerges as the immediate support following the 38.2% Fibonacci retracement at 146.32.
The US Dollar (USD) has plunged to a nearly three-month low, influenced by dovish expectations from the Federal Reserve (Fed). This development is a significant factor contributing to the decline of the USD/JPY pair.
The 14-day Relative Strength Index (RSI) lies below the 50 level, signaling a weaker sentiment for the USD/JPY pair. This could potentially prompt bearish movements toward the psychological support region around 146.00. If a decisive break occurs below this level, it may pave the way for the USD/JPY pair to navigate the area near the 50.0% retracement at the 144.60 level.
Moreover, the Moving Average Convergence Divergence (MACD) line is positioned below the centerline and diverges below the signal line, signaling a bearish momentum in the market for the USD/JPY pair.
On the upside, the major level at 147.50 serves as the immediate barrier, followed by the psychological level at 148.00. A breakthrough above the latter could provide support for the USD/JPY pair to explore the region around the 149.00 level following the nine-day Exponential Moving Average (EMA) at 149.62.
USD/JPY: Daily Chart
Reprinted from FXStreet_id,the copyright all reserved by the original author.
Disclaimer: The content above represents only the views of the author or guest. It does not represent any views or positions of FOLLOWME and does not mean that FOLLOWME agrees with its statement or description, nor does it constitute any investment advice. For all actions taken by visitors based on information provided by the FOLLOWME community, the community does not assume any form of liability unless otherwise expressly promised in writing.
FOLLOWME Trading Community Website: https://www.followme.com


Hot
No comment on record. Start new comment.