EUR/USD Price Analysis: Gains momentum above 1.0950 amid overbought condition

- EUR/USD extends its upside above 1.0950, up 0.18% on the day.
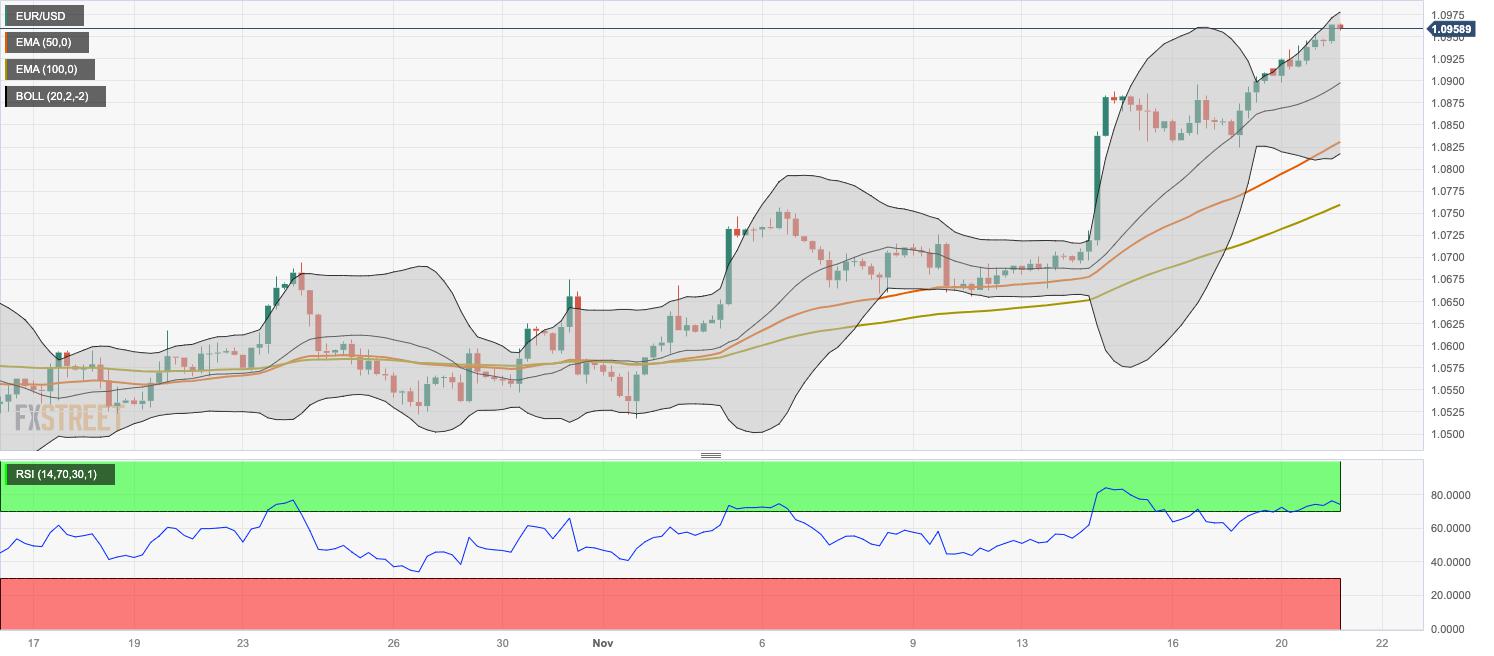
- The pair holds above the 50- and 100-hour EMA with the overbought RSI condition.
- The first upside barrier is seen at 1.0978; the 1.0895–1.0900 zone acts as an initial support level for the pair.
The EUR/USD pair trades in positive territory for the fourth consecutive day during the early European session on Tuesday. The weaker US dollar and lower US Treasury bond yields lend some support to EUR/USD. Investors will take more cues from the Federal Open Market Committee (FOMC) Meeting Minutes on Tuesday, which could potentially provide insights into the trajectory of future policy rates.
According to the four-hour chart, the bullish potential of EUR/USD remains intact as the major pair holds above the 50- and 100-hour Exponential Moving Averages (EMA). It’s worth noting that the Relative Strength Index (RSI) holds in bullish territory above 50. However, the overbought RSI condition indicates that further consolidation cannot be ruled out before positioning for any near-term EUR/USD appreciation.
That being said, the immediate resistance level for EUR/USD is seen near the upper boundary of the Bollinger Band at 1.0978. The critical upside barrier is located near a psychological round figure and a high of August 11 at 1.1000. Any follow-through buying will see a rally to a high of August 4 at 1.1042, en route to a high of July 27 at 1.1149.
On the downside, the 1.0895–1.0900 region acts as an initial support level for the major pair. The mentioned level is the confluence of the psychological mark and a high of November 16. Further south, the next contention level will emerge near the lower limit of the Bollinger Band at 1.0817. A break below the latter will see a drop to the 50-hour EMA at 1.0759, followed by a high of November 9 at 1.0725.
EUR/USD four-hour chart
Reprinted from FXStreet_id,the copyright all reserved by the original author.
Disclaimer: The content above represents only the views of the author or guest. It does not represent any views or positions of FOLLOWME and does not mean that FOLLOWME agrees with its statement or description, nor does it constitute any investment advice. For all actions taken by visitors based on information provided by the FOLLOWME community, the community does not assume any form of liability unless otherwise expressly promised in writing.
FOLLOWME Trading Community Website: https://www.followme.com


Hot
No comment on record. Start new comment.