NZD/JPY extends losses, as bulls struggle to gather momentum

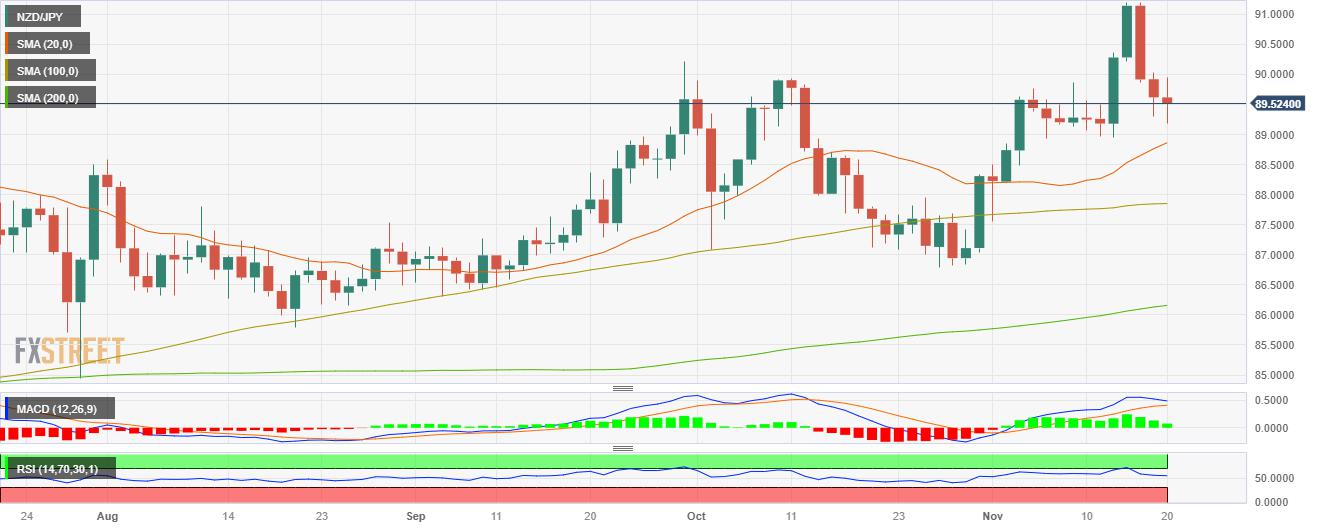
- NZD/JPY sits at 89.50, noting minor losses as market sentiment skews somewhat bearish
- Subdued buying momentum is signalled by the RSI's negative gradient on the daily chart and the diminishing green bars of the MACD histogram.
- On the broader context, the pair's ascendancy above the 20, 100, 200-day SMA suggests bullish control.
On Monday's session, the NZD/JPY pair was seen trading at around 89.50, suffering slight losses. Indicators reflect that the buying momentum is diminishing after the pair rose to a multi-year high of around 2015 last week, as investors continue to take profits.
On the daily chart, the negative slope of the Relative Strength Index (RSI), though within the positive territory, along with the decreasing green bars of the Moving Average Convergence Divergence (MACD), hint towards a slowdown in buying momentum. However, the pair's position above its 20, 100, and 200-day Simple Moving Averages (SMAs) suggests that bulls have a firm grip on the broader outlook, indicative of possible resiliency in the buying pressure.
A glimpse at the shorter time frame based on the four-hour chart outlook adds a different perspective. The flat slope of the Relative Strength Index (RSI) below its middlepoint next to the decreasing green red of the four-hour Moving Average Convergence Divergence (MACD) hinders the selling momentum, indicating that in the near short-term, the buyers may step in.
Support Levels: 89.10, 88.84 (20-day SMA), 88.50.
Resistance Levels: 89.70, 90.00, 90.30.
NZD/JPY daily chart
Reprinted from FXStreet_id,the copyright all reserved by the original author.
Disclaimer: The content above represents only the views of the author or guest. It does not represent any views or positions of FOLLOWME and does not mean that FOLLOWME agrees with its statement or description, nor does it constitute any investment advice. For all actions taken by visitors based on information provided by the FOLLOWME community, the community does not assume any form of liability unless otherwise expressly promised in writing.
FOLLOWME Trading Community Website: https://www.followme.com


Hot
No comment on record. Start new comment.