AUD/JPY Price Analysis: Friday's bullish close looking for a rebound into 98.00

- The AUD/JPY saw a late break higher in Friday's broad-market sentiment recovery.
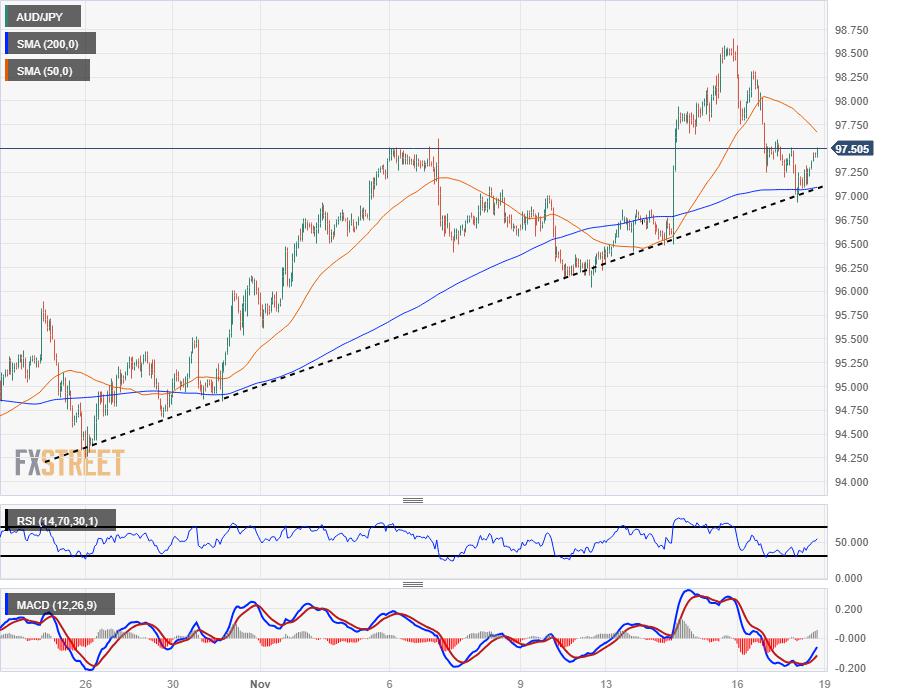
- The Aussie is catching a bounce from the 200-hour SMA and a rising trendline.
- The technicals are leaning bullish with more upside on the cards, but headwinds remain.
The AUD/JPY snuck over the 97.50 level just ahead of the Friday closing bell, trying to claw back some of the midweek's losses after the pair tumbled from a Wednesday peak of 98.66.
The AUD/JPY closed out the trading week with some gains, up nearly 1.2% from Monday's opening bids near 96.40, but the back half of the week was marred by a 1.75% decline that only saw a minor paring back in late Friday trading.
With the Aussie (AUD) bouncing off a technical confluence of the 200-hour Simple Moving Average (SMA) and a rising trendline drawn from late October's swing low into 94.25, the pair is set for a bullish continuation as long as broad-market fundamentals keep risk appetite on the high side.
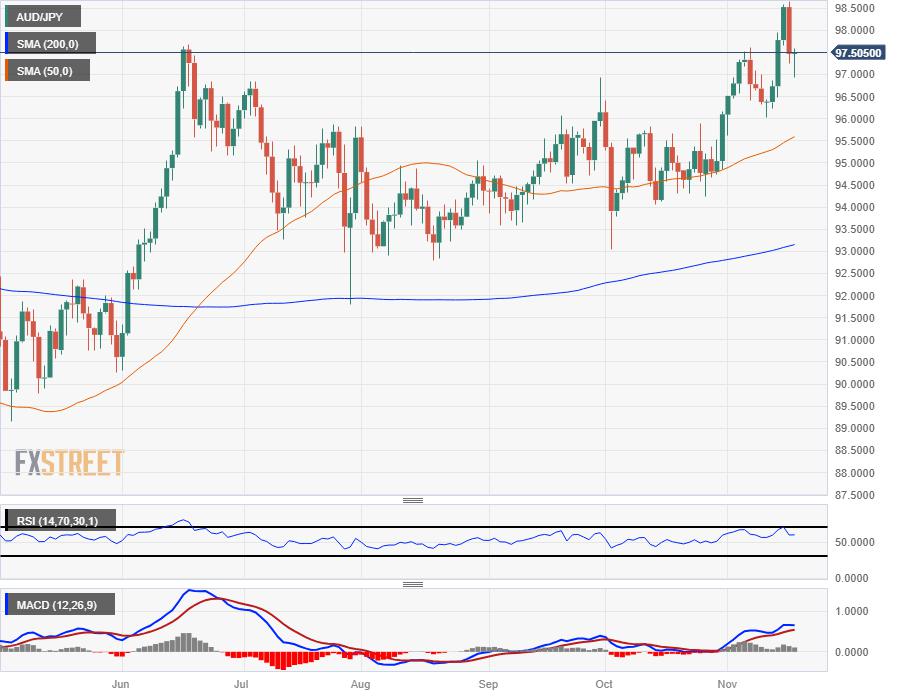
Daily candlesticks are flashing warning signs that the current bullish push could be running out of gas.
The AUD/JPY is at risk of getting pulled back towards the 50-day SMA near 95.50, and long-term technical support is far below current price action at the 200-day SMA rising from 93.00.
November's rise out of October's consolidation phase could face a near-term bearish breakdown, with the last swing low into the 96.00 handle acting as the immediate support level for bears to beat.
AUD/JPY Hourly Chart
AUD/JPY Daily Chart
AUD/JPY Technical Levels
Reprinted from FXStreet_id,the copyright all reserved by the original author.
Disclaimer: The content above represents only the views of the author or guest. It does not represent any views or positions of FOLLOWME and does not mean that FOLLOWME agrees with its statement or description, nor does it constitute any investment advice. For all actions taken by visitors based on information provided by the FOLLOWME community, the community does not assume any form of liability unless otherwise expressly promised in writing.
FOLLOWME Trading Community Website: https://www.followme.com


Hot
No comment on record. Start new comment.