EUR/GBP Price Analysis: The upside barrier is seen at the 0.8750-55 zone

- EUR/GBP gains ground near 0.8745 on weaker UK inflation data.
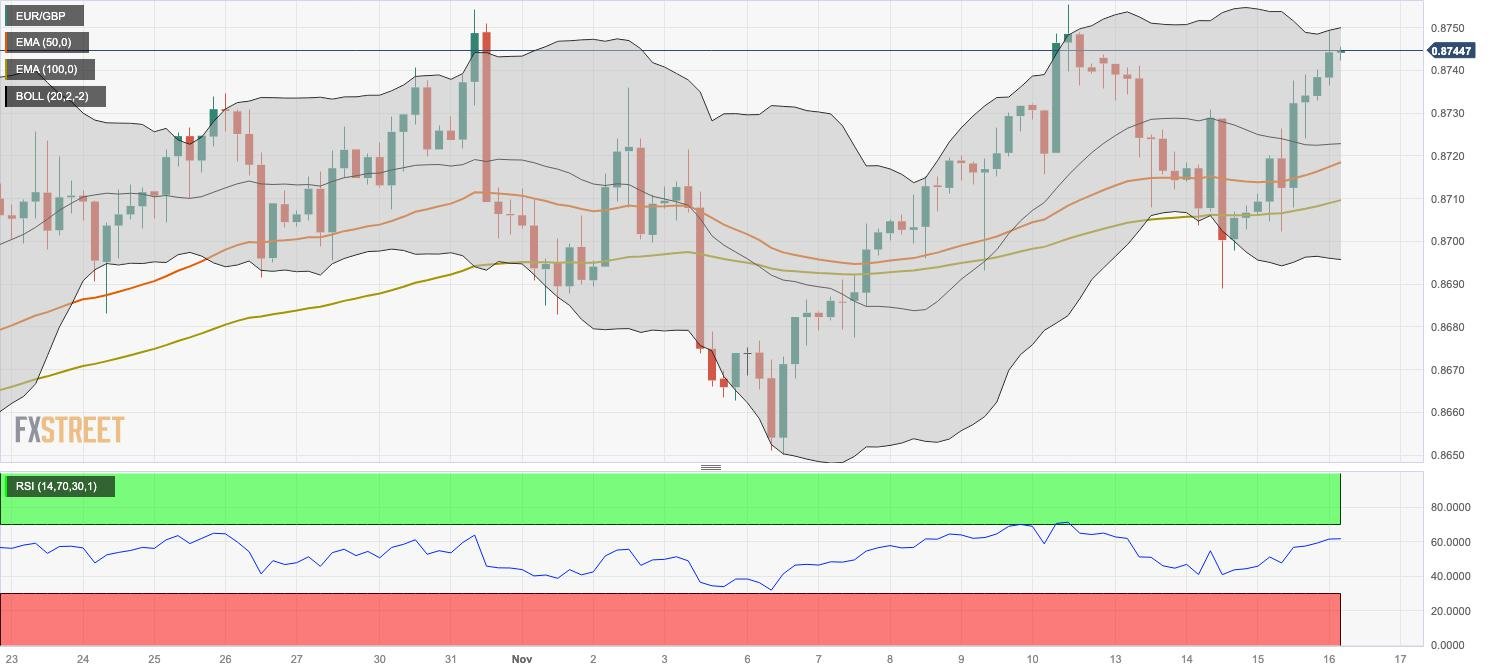
- The cross holds above the 50- and 100-hour EMA; RSI indicator stands in bullish territory above 50.
- The 0.8750-0.8755 zone acts as an immediate resistance level; the initial support level is located at 0.8721.
The EUR/GBP cross extends its upside during the early European session on Thursday. The downbeat UK Consumer Price Index (CPI) data on Wednesday weighs on the British Pound (GBP) and acts as a tailwind for the EUR/GBP cross. Additionally, the GBP’s upside might be capped due to the possibility of cutting interest rates from the Bank of England (BoE) soon. At press time, the cross is trading around 0.8745, up 0.09% on the day.
From a technical perspective, EUR/GBP holds above the 50- and 100-hour Exponential Moving Averages (EMAs) on the four-hour chart, highlighting the path of least resistance for EUR/GBP is to the upside. Furthermore, the Relative Strength Index (RSI) stands in bullish territory above 50, supporting the buyers for now.
The 0.8750-0.8755 region acts as an immediate resistance level for the cross. The mentioned level is the confluence of the upper boundary of the Bollinger Band and a high of November 10. A decisive break above the latter will see a rally to 0.8835 (a high of May 3). Further north, the additional upside filter is seen at 0.8865 (high of April 25).
On the downside, the initial support level for the cross is located near a high of November 3 at 0.8721. The next contention level will emerge near the 100-hour EMA at 0.8710. Any follow-through selling below the latter will see a drop to the 0.8695–0.8700 zone, representing the lower limit of the Bollinger Band and a psychological round figure.
EUR/GBP four-hour chart
Reprinted from FXStreet_id,the copyright all reserved by the original author.
Disclaimer: The content above represents only the views of the author or guest. It does not represent any views or positions of FOLLOWME and does not mean that FOLLOWME agrees with its statement or description, nor does it constitute any investment advice. For all actions taken by visitors based on information provided by the FOLLOWME community, the community does not assume any form of liability unless otherwise expressly promised in writing.
FOLLOWME Trading Community Website: https://www.followme.com


Hot
No comment on record. Start new comment.