GBP/USD Price Analysis: Hovers below 1.2400 backed by 38.2% Fibonacci retracement

- GBP/USD could extend losses toward the support level at 1.2350.
- Technical indicators suggest a robust momentum in favor of the pair.
- A decisive breakthrough above 1.2400 could encourage bullish sentiment.
GBP/USD extends losses on the second consecutive day, trading lower around 1.2390 during the Asian session on Thursday. The 1.2350 major level emerges as the key support, following the next support around the psychological level at 1.2300.
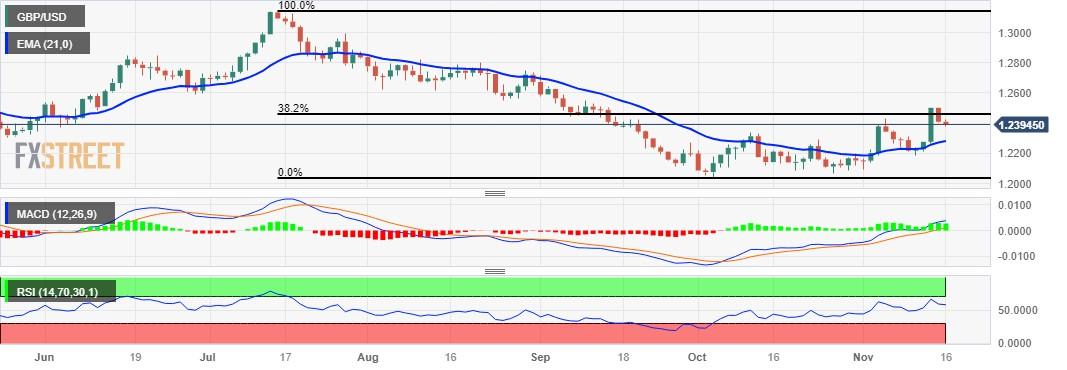
A break below the latter could weigh on the GBP/USD pair to navigate the region around the 21-day Exponential Moving Average (EMA) at 1.2282 level following the weekly low at 1.2213.
However, the technical indicator for the GBP/USD pair indeed presents a bullish outlook. The 14-day Relative Strength Index (RSI) above the 50 level indicates upward support, signifying a robust momentum in favor of the pair.
Additionally, the Moving Average Convergence Divergence (MACD) line, situated above the centerline and shown divergence above the signal line, suggests a bullish momentum in the GBP/USD pair.
On the upside, the GBP/USD pair trades below the key psychological level of 1.2400, which serves as a strong resistance. A decisive breakthrough above this barrier has the potential to encourage bullish sentiment, opening the path towards the major level at 1.2450 aligned with the 38.2% Fibonacci retracement at 1.2459. If this resistance is successfully surpassed, the pair may target the 1.2500 level, aligning with the weekly high at 1.2505.
GBP/USD: Daily Chart
Reprinted from FXStreet_id,the copyright all reserved by the original author.
Disclaimer: The content above represents only the views of the author or guest. It does not represent any views or positions of FOLLOWME and does not mean that FOLLOWME agrees with its statement or description, nor does it constitute any investment advice. For all actions taken by visitors based on information provided by the FOLLOWME community, the community does not assume any form of liability unless otherwise expressly promised in writing.
FOLLOWME Trading Community Website: https://www.followme.com


Hot
No comment on record. Start new comment.