Silver Price Analysis: XAG/USD retreats further from $23.60-70 barrier/multi-week top

- Silver snaps a three-day winning streak to a near four-week high touched on Wednesday.
- The technical setup seems tilted in favour of bulls and should help limit any further losses.
- Bulls still need to wait for a move beyond the $23.60-70 barrier before placing fresh bets.
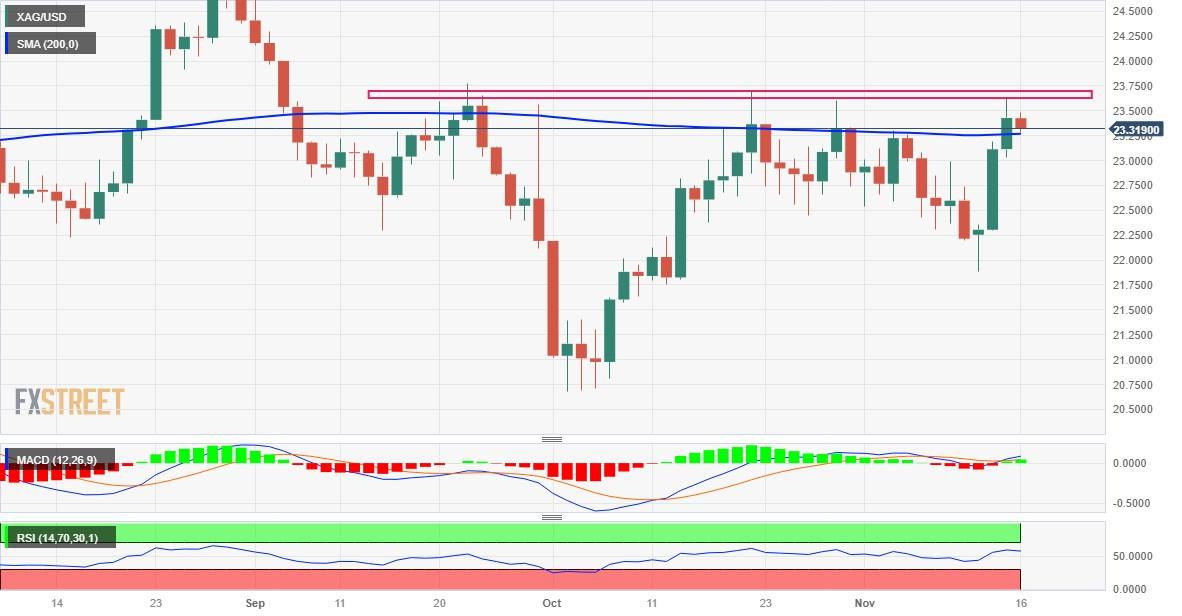
Silver (XAG/USD) meets with some supply during the Asian session on Thursday and moves further away from a near four-week high touched the previous day. The white metal currently trades around the $23.30 area, down over 0.50% for the day, and for now, seems to have snapped a three-day winning streak.
From a technical perspective, the overnight close above the very important 200-day Simple Moving Average (SMA) could be seen as a fresh trigger for bullish traders. Moreover, oscillators on the daily chart have just started gaining positive traction and add credence to the constructive outlook. That said, failure to break through the $23.60-$23.70 horizontal barrier prompts some long-unwinding on Thursday.
Hence, it will be prudent to wait for strong follow-through buying and acceptance above the aforementioned hurdle before positioning for an extension of this week's bounce from sub-$22.00 levels, or the monthly low. The XAG/USD might then climb further towards reclaiming the $24.00 mark en route to the $24.20-$24.25 intermediate resistance, before making a fresh attempt to conquer the $25.00 psychological mark.
On the flip side, any further decline below the $23.00 mark could attract fresh buying and remain limited near the $22.35-$22.30 area, This is followed by the $22.00 mark, which if broken decisively will shift the near-term bias back in favour of bearish traders. Some follow-through selling below the $21.85 region, or the monthly low, will reaffirm the negative outlook and drag the XAG/USD towards the $21.35-$21.30 support.
The downward trajectory could get extended further below the $21.00 round figure, towards challenging the multi-month low, around the $20.70-$20.65 area touched in October.
Silver daily chart
Technical levels to watch
Reprinted from FXStreet_id,the copyright all reserved by the original author.
Disclaimer: The content above represents only the views of the author or guest. It does not represent any views or positions of FOLLOWME and does not mean that FOLLOWME agrees with its statement or description, nor does it constitute any investment advice. For all actions taken by visitors based on information provided by the FOLLOWME community, the community does not assume any form of liability unless otherwise expressly promised in writing.
FOLLOWME Trading Community Website: https://www.followme.com


Hot
No comment on record. Start new comment.