NZD/USD Price Analysis: Inverted H&S in progress

- NZD/USD eyes stabilization above 0.6000 amid easing US price pressures.
- Further action in the US Dollar will be guided by the monthly US Retail Sales data.
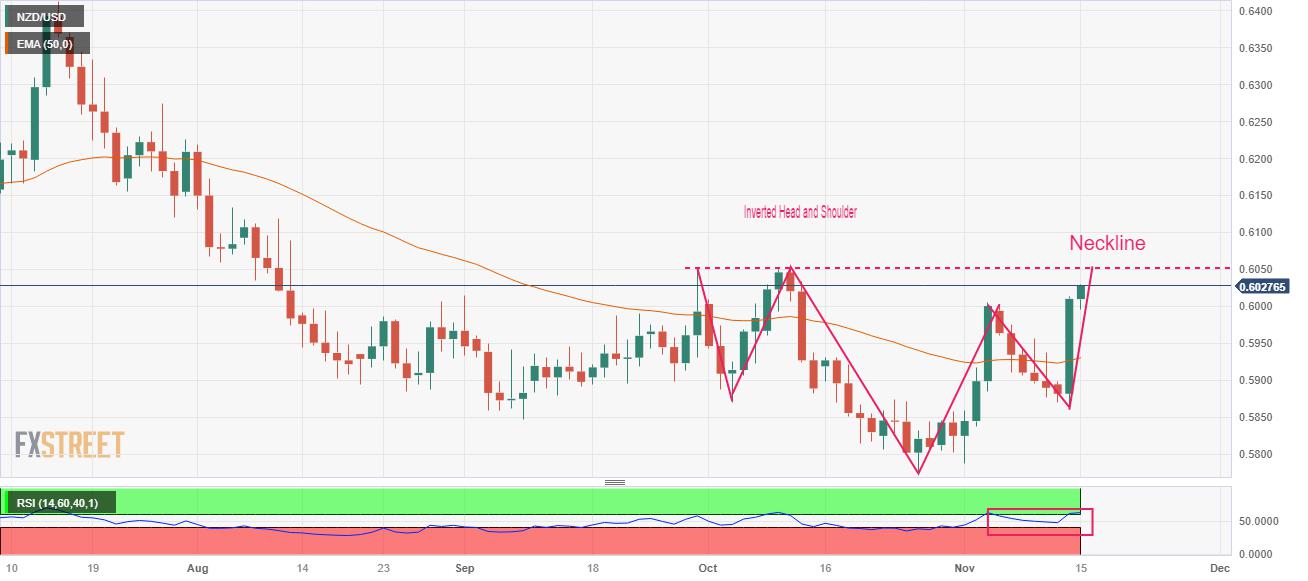
- NZD/USD forms an Inverted Head and Shoulder chart pattern.
The NZD/USD pair aims for stability above the psychological resistance of 0.6000 as the market mood has turned bullish due to easing price pressures in the United States economy. The Kiwi asset turns upbeat as investors hope that the Federal Reserve (Fed) is done with hiking interest rates as progress in inflation declining towards 2% is steady.
S&P500 futures generated decent gains in the Asian session, indicating a significant improvement in the risk-taking ability of the market participants. The US Dollar Index (DXY) hovers near a two-month low around 104.00.
Further action in the US Dollar will be guided by the monthly US Retail Sales data for October, which will be published at 13:30 GMT. As per the consensus, consumer spending contracted by 0.3% against 0.7% growth in September.
NZD/USD forms an Inverted Head and Shoulder chart pattern on a daily scale, which indicates a prolonged consolidation. A breakout of the aforementioned chart pattern will result in a bullish reversal. The asset climbs above the 50-day Exponential Moving Average (EMA), which indicates that the major trend has turned bullish.
The Relative Strength Index (RSI) (14) aims to shift into the bullish range of 60.00-80.00. If the RSI (14) manages to do so, a bullish momentum will get triggered.
More upside would appear if the asset breaks above the neckline of the inverted H&S pattern, which is placed from September 29 high at 0.6050. This will result in further upside towards August 11 high near 0.6090 followed by August 4 high at 0.6133.
In an alternate scenario, a breakdown below November 14 low at 0.5863 would drag the asset toward November 2 low at 0.5838. Further decline below the latter would expose the asset to October 26 low at 0.5772.
NZD/USD daily chart
Reprinted from FXStreet_id,the copyright all reserved by the original author.
Disclaimer: The content above represents only the views of the author or guest. It does not represent any views or positions of FOLLOWME and does not mean that FOLLOWME agrees with its statement or description, nor does it constitute any investment advice. For all actions taken by visitors based on information provided by the FOLLOWME community, the community does not assume any form of liability unless otherwise expressly promised in writing.
FOLLOWME Trading Community Website: https://www.followme.com


Hot
No comment on record. Start new comment.