Gold Price Forecast: XAU/USD attracts some buyers above $1,940, investors await the US CPI data

- Gold price posts a modest recovery around $1,946 on the softer USD.
- Gold traders will monitor the US inflation data on Tuesday.
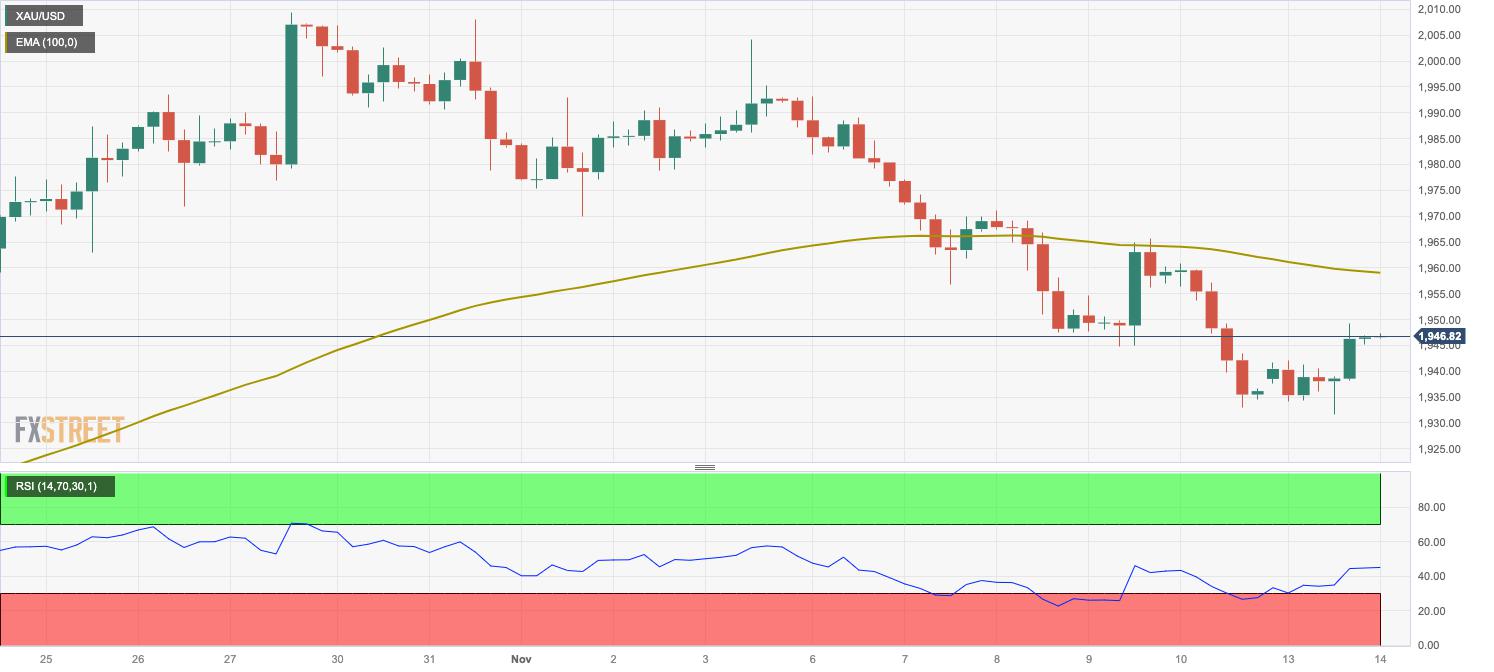
- The first resistance level is seen at $1,960; the initial support level will emerge at $1,930.
Gold price (XAU/USD) attracts some buyers and currently trades around $1,946 during the early Asian trading hours on Tuesday. The uptick of the precious metal is supported by the softer US Dollar (USD) and a decline in US Treasury bond yields. Investors await the US Consumer Price Index (CPI) data for October for fresh impetus, which is expected to rise 0.1% MoM and 3.3% YoY. The core CPI is estimated to grow 0.3% MoM and 4.1% YoY.
Meanwhile, the US dollar loses traction to 105.65 after retracing from the 106.00 mark. The US Treasury bond yields edge lower, with the 10-year yield standing at 4.63%.
The New York Fed’s survey of consumer expectations showed the 1-year and 5-year inflation outlook eased to 3.57% and 2.72% respectively. The US inflation on Tuesday might convince the Federal Reserve (Fed) for additional tightening as FOMC views are warranted by the data. Gold traders will take more cues from Federal Reserve (Fed) officials during the week, including Fed Vice-Chairman Philip Jefferson, New York Fed’s John Williams, and Lisa Cook.
XAU/USD Technical Outlook
According to the four-hour chart, the gold price will meet the first resistance level near the 100-hour EMA at $1,960. The additional upside filter is seen near a high of November 8 at $1,971, followed by a psychological figure at $2,000. On the downside, the initial support level is located at $1,930, en route to a low of October 16 at $1,908, and finally $1,900 (a round figure).
Reprinted from FXStreet_id,the copyright all reserved by the original author.
Disclaimer: The content above represents only the views of the author or guest. It does not represent any views or positions of FOLLOWME and does not mean that FOLLOWME agrees with its statement or description, nor does it constitute any investment advice. For all actions taken by visitors based on information provided by the FOLLOWME community, the community does not assume any form of liability unless otherwise expressly promised in writing.
FOLLOWME Trading Community Website: https://www.followme.com


Hot
No comment on record. Start new comment.