EUR/GBP easing back towards 0.8700 heading into data double-header

- The EUR/GBP is seeing downside drift ahead of Tuesday's data headliners.
- The Euro is falling back after last week's steady climb.
- Up Next: UK wages & labor, EU labor & GDP.
The EUR/GBP is softening ahead of a key data double-header for both the EU and the UK, with labor, wages, and Gross Domestic Product (GDP) numbers.
The Euro (EUR) is falling back against the Pound Sterling (GBP) heading into the Tuesday market session, declining around 0.4% peak-to-trough on Monday.
UK Average Earnings for the 3rd quarter is expected to decline slightly from 7.8% to 7.7%, while earnings including bonuses is expected to tick downward at a fast pace, from 8.1% to 7.4%.
The UK will also be seeing Employment Change for September, which last showed the UK shed 82 thousand jobs over the month, while Claimant Count Change in October showed an increase in unemployment benefits seekers to the tune of nearly 20.5 thousand.
On the EU side, quarter-on-quarter Employment Change for the 3rd quarter is expected to show a moderate 0.2% gain, while the EU's pan-continental GDP for the quarter is expected to print at a steady reading of -0.1%.
EUR/GBP Technical Outlook
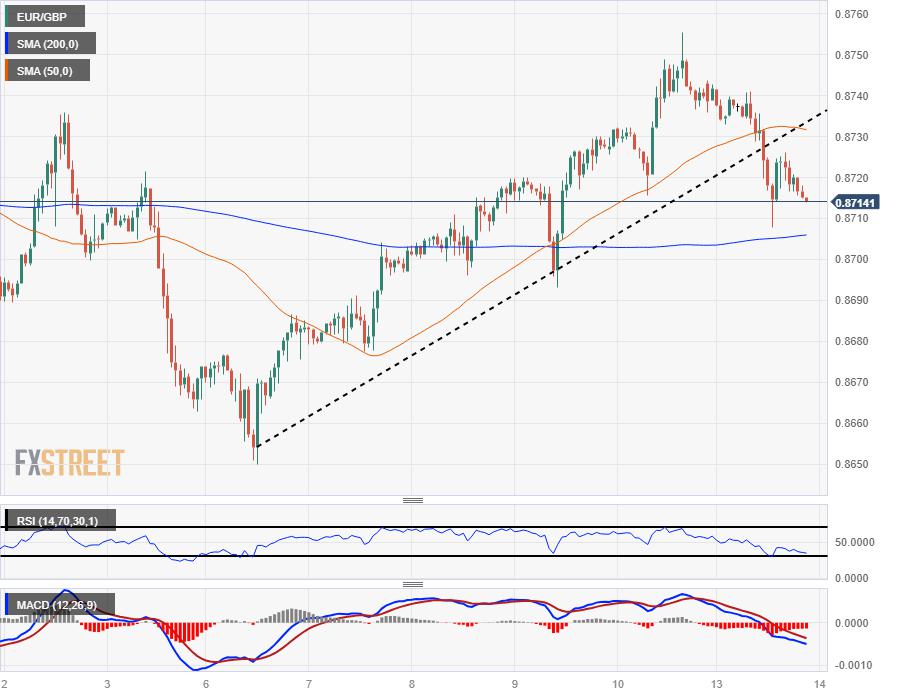
The Euro is falling back into the 200-hour Simple Moving Average (SMA) Against the Pound Sterling, paring back some of the pair's gains from last week.
Monday's decline trims away gains from the swing high into 0.8755, slipping into the bearish side of a rising trendline from last week's low bids near 0.8650.
With the EUR/GBP drifting towards the midrange in the near-term, bidders will be waiting for a downside break of the 0.8700 handle before re-upping positions, while sellers will be considering a trimming below the same level.
EUR/GBP Hourly Chart
EUR/GBP Technical Levels
Reprinted from FXStreet_id,the copyright all reserved by the original author.
Disclaimer: The content above represents only the views of the author or guest. It does not represent any views or positions of FOLLOWME and does not mean that FOLLOWME agrees with its statement or description, nor does it constitute any investment advice. For all actions taken by visitors based on information provided by the FOLLOWME community, the community does not assume any form of liability unless otherwise expressly promised in writing.
FOLLOWME Trading Community Website: https://www.followme.com


Hot
No comment on record. Start new comment.