USD Index Price Analysis: Next hurdle emerges around 106.00

- DXY navigates within a tight range still below 106.00.
- Further upside momentum should challenge the 106.00 barrier.
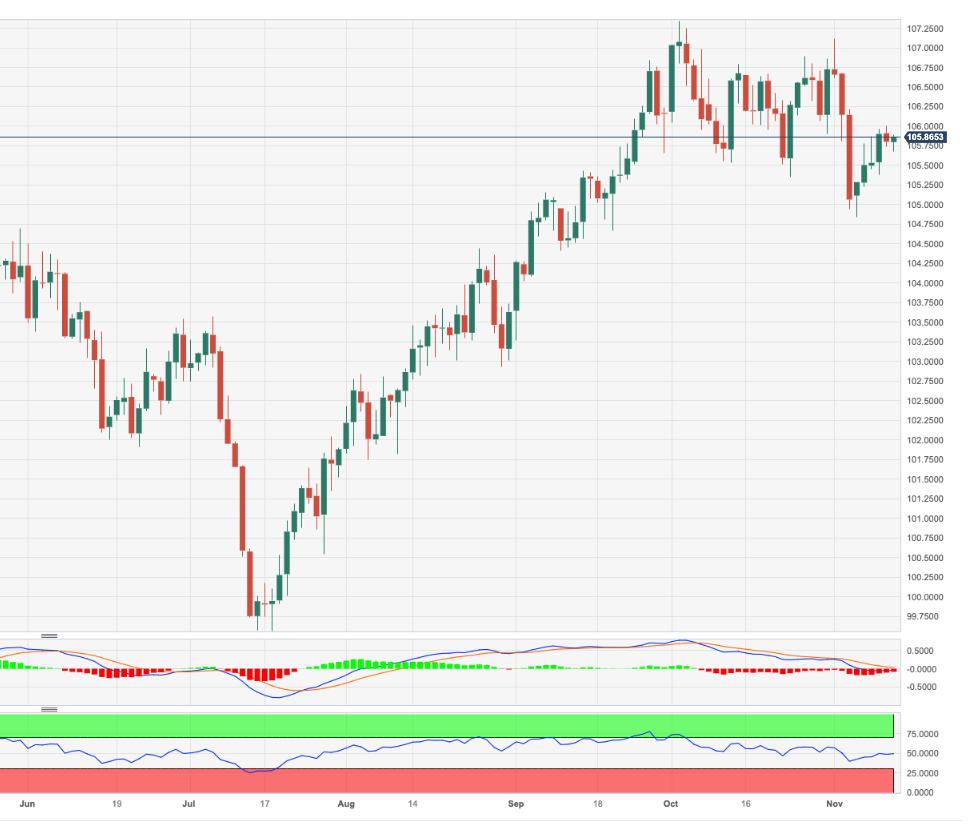
DXY looks to extend further last week’s rebound, although the 106.00 region proves to be quite a strong barrier for the time being.
Once the 106.00 hurdle is cleared, the index could then embark on a potential test of the November peak at 107.11 (November 1) ahead of the 2023 high of 107.34 (October 3).
In the meantime, while above the key 200-day SMA, today at 103.60, the outlook for the index is expected to remain constructive.
DXY daily chart
Reprinted from FXStreet_id,the copyright all reserved by the original author.
Disclaimer: The content above represents only the views of the author or guest. It does not represent any views or positions of FOLLOWME and does not mean that FOLLOWME agrees with its statement or description, nor does it constitute any investment advice. For all actions taken by visitors based on information provided by the FOLLOWME community, the community does not assume any form of liability unless otherwise expressly promised in writing.
FOLLOWME Trading Community Website: https://www.followme.com


Hot
No comment on record. Start new comment.