NZD/JPY advances slightly but closes a losing week

- NZD/JPY rose nearly 0.10% towards the 89.245 area
- The cross continues to side-ways trades, slightly tilted to the downside.
- Bulls seem to be taking a breather after last week’s 3% gains.
The NZD/JPY will close a 0.30% losing week around the 89.245 area, as investors are taking profits from the early month's sharp gains.
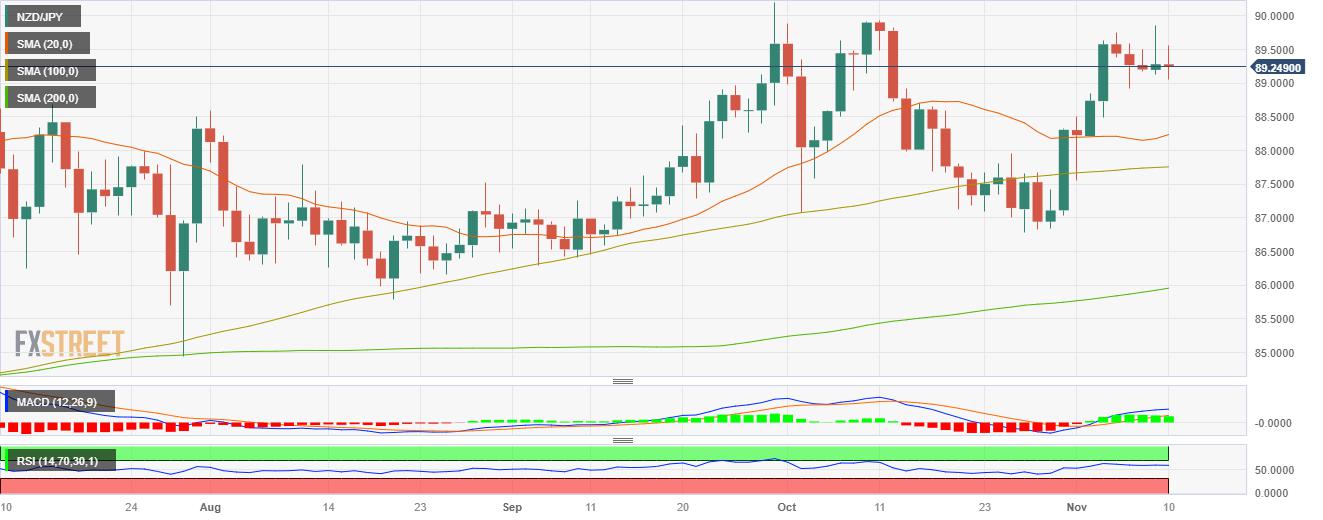
Observing the daily chart, the NZD/JPY displays signs of bullish exhaustion after the cross gained more than 3% at the beginning of November. The Relative Strength Index (RSI) has turned flat above its midline, while the Moving Average Convergence (MACD) prints neutral green bars. On the four-hour chart, the indicators have also flattened but are also slightly lilted to the upside, suggesting that buyers are consolidating gains.
Additionally, the cross is above the 20,100,200-day Simple Moving Average (SMA), suggesting that the outlook also favours the bulls in the larger time frames. Furthermore, there could be a bullish confirmation as the 100-day SMA is converging towards the 20-day average to perform a bullish cross, which could reignite the momentum for the buyers in the short term.
Support levels: 89.000, 88.700, 88.500.
Resistance levels: 89.5000, 89.850,90.000.
NZD/JPY Daily Chart
Reprinted from FXStreet_id,the copyright all reserved by the original author.
Disclaimer: The content above represents only the views of the author or guest. It does not represent any views or positions of FOLLOWME and does not mean that FOLLOWME agrees with its statement or description, nor does it constitute any investment advice. For all actions taken by visitors based on information provided by the FOLLOWME community, the community does not assume any form of liability unless otherwise expressly promised in writing.
FOLLOWME Trading Community Website: https://www.followme.com


Hot
No comment on record. Start new comment.