NZD/USD Price Analysis: Hovers near the immediate barrier at 0.5900 psychological level

- NZD/USD struggles to halt the losing streak amid improved US Dollar.
- MACD suggests tepid momentum, monitoring for potential shifts in market dynamics.
- The pair could revisit the 1.0750 major level aligned to the weekly high at 1.0756.
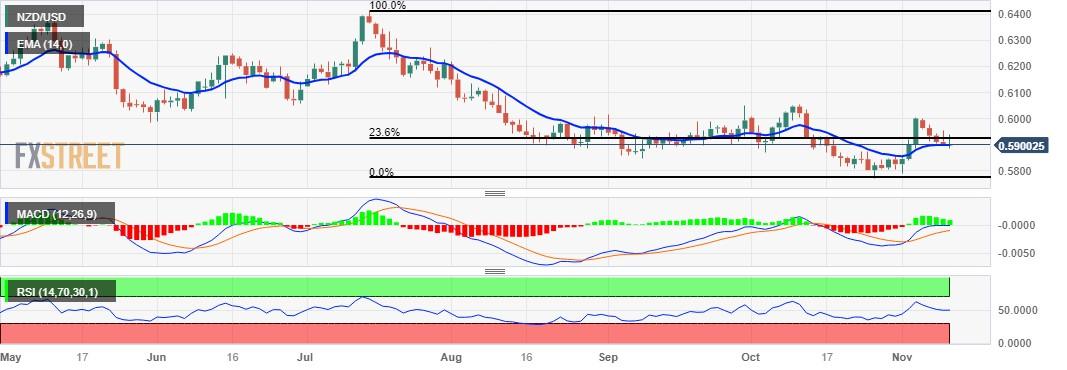
NZD/USD continues the losing streak for the fifth successive day, trading around the 14-day Exponential Moving Average (EMA) at 0.5898 during the European trading hours on Friday, lined up with the immediate resistance at 0.5900. Fed Chair Jerome Powell's endorsement of further interest rate hikes has exerted downward pressure on the Kiwi pair.
The 23.6% Fibonacci retracement level at 0.5923 is identified as a crucial resistance point in the event of the NZD/USD pair making further advances. If the pair manages to firmly break above this level, it could provide support for bullish momentum, allowing traders to explore the region around the previous week's high at the psychological level of 0.6000.
The 14-day Relative Strength Index (RSI) lies below the 50 level, indicating downward pressure. This suggests a bearish momentum and reflects a weaker market sentiment for the NZD/USD pair. As a result, the pair may be pushed toward major support at the 0.5800 psychological level, with the next potential level of support being the previous week's low at 0.5789.
However, the Moving Average Convergence Divergence (MACD) line is positioned below the centerline but above the signal line in the NZD/USD pair. This configuration suggests a subdued momentum, reflecting a state of uncertainty in the market. Traders may monitor this situation closely for potential shifts in market dynamics.
NZD/USD: Daily Chart
Reprinted from FXStreet_id,the copyright all reserved by the original author.
Disclaimer: The content above represents only the views of the author or guest. It does not represent any views or positions of FOLLOWME and does not mean that FOLLOWME agrees with its statement or description, nor does it constitute any investment advice. For all actions taken by visitors based on information provided by the FOLLOWME community, the community does not assume any form of liability unless otherwise expressly promised in writing.
FOLLOWME Trading Community Website: https://www.followme.com


Hot
No comment on record. Start new comment.