EUR/USD Price Analysis: Consolidates its losses above 1.0660 ahead of ECB’s Lagarde speech

- EUR/USD oscillates around the 1.0663-1.0675 region in a narrow trading band.
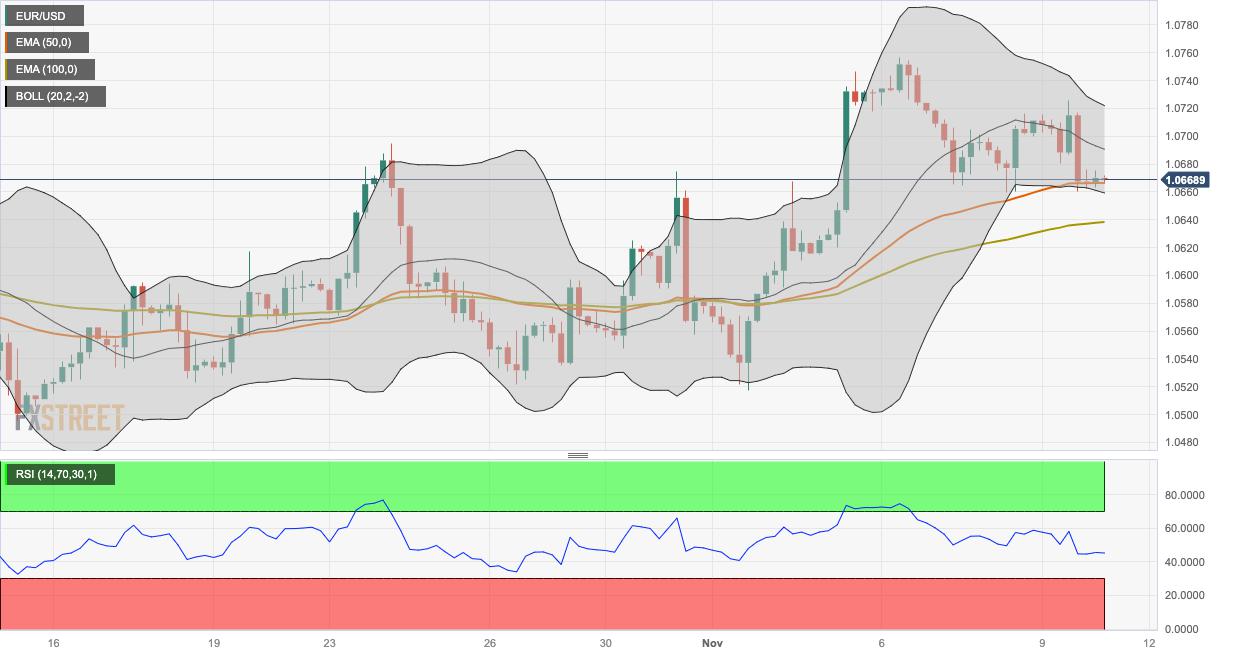
- The pair holds above the key 100-hour Exponential Moving Averages (EMA), but the RSI indicator is located in bearish territory.
- The first immediate resistance level will emerge at 1.0725; 1.0659 acts as an initial support level.
The EUR/USD pair consolidates its losses during the early European session on Friday. The hawkish comments from the Federal Reserve (Fed) Chairman Jerome Powell lift the US Dollar (USD) broadly and weigh on the pair. The major pair currently trades around 1.0669, up 0.05% on the day.
Technically, the EUR/USD pair holds above the key 100-hour Exponential Moving Averages (EMA), suggesting the path of least resistance is to the upside. However, the Relative Strength Index (RSI) is located in bearish territory under 50, which indicates the sellers are likely to retain control in the near term.
The first upside barrier for the major pair will emerge at 1.0725, representing the confluence of the upper boundary of Bollinger Band and a high of November 9. Any decisive break above the latter will pave the way to a high of November 6 at 1.0756. Further north, the next upside stop is located near the psychological round mark at 1.0800.
On the downside, the lower limit of the Bollinger Band at 1.0659 acts as an initial support level for EUR/USD. The next contention level is seen at 1.0638 (the 100-hour EMA). The additional downside filter to watch is 1.0600, portraying a round figure and a high of October 27. A breach of the latter will see a drop to 1.0535 (a low of October 27), followed by 1.0517 (a low of November 1).
EUR/USD four-hour chart
Reprinted from FXStreet_id,the copyright all reserved by the original author.
Disclaimer: The content above represents only the views of the author or guest. It does not represent any views or positions of FOLLOWME and does not mean that FOLLOWME agrees with its statement or description, nor does it constitute any investment advice. For all actions taken by visitors based on information provided by the FOLLOWME community, the community does not assume any form of liability unless otherwise expressly promised in writing.
FOLLOWME Trading Community Website: https://www.followme.com


Hot
No comment on record. Start new comment.