Silver Price Analysis: XAG/USD soars and reclaims the 20-day SMA, eyes on rising yields

- The XAG/USD soared more than 1.50% to $22.90, just above the 20-day SMA.
- Amid hawkish words from Fed’s Barking, US yields are rising, which could limit the upside.
- Weekly Jobless Claims from the US came in lower than expected.
- A sour market mood an escalating tensions in the Middle East.
On Thursday, the XAG/USD spot price rose back above the 20-day Simple Moving Average, towards $22.90, seeing sharp gains. That being said, US yields rose after lower-than-expected US weekly Jobless Claims and hawkish words from the Federal Reserve’s (Fed) Thomas Barking, which may limit the upside for the rest of the session.
On the data front, the U.S. Department of Labor revealed that the Initial Jobless Claims from the week ending on November 4 missed the consensus. The people filling for unemployment benefits came in at 217,000, lower than the consensus of 218,000 and fell in relation to it last reading of 220,000. In addition, during the American session, Thomas Barkin commented that in his perspective, inflation is “too high” and that he isn’t convinced that it is not on a smooth path towards the 2% goal.
As a reaction, the US Treasury yields, often seen as the cost of holding non-yielding metal, are edging higher, with the 2,5 and 10-year yields advancing towards 4.96% and 4.55%, respectively. Still, according to the CME FedWatch Tool, the odds of a 25 basis points hike in the Fed’s December meeting remain low, around 10%, and markets seem to be awaiting high-tier data to continue placing their bets on the next decisions. The US will report inflation figures from October next week.
XAG/USD Levels to watch
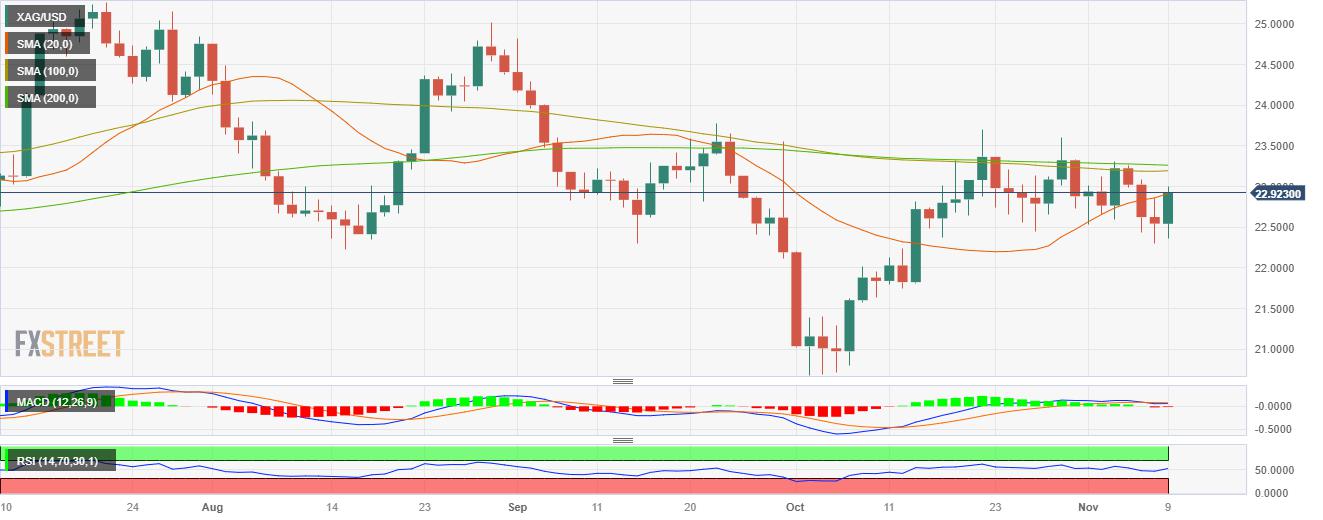
Observing the daily chart, the XAG/USD Index displays a neutral to bearish technical outlook for the short term as despite gaining significant traction, the bullish momentum is still weak. The Relative Strength Index (RSI) indicates a neutral stance below its midline, displaying a flat slope in the negative territory, while the Moving Average Convergence (MACD) prints stagnant red bars. Furthermore, the price is above the 100 and 200-day Simple Moving Averages (SMAs), suggesting that the bulls are in command over the bears on the bigger picture.
Resistance levels: $23.00, $23.15,$23.30 (100 and 200-day SMA convergence).
Support levels: $22.90 (20-day SMA), $22.70, $22.50.
XAG/USD Daily chart
Reprinted from FXStreet_id,the copyright all reserved by the original author.
Disclaimer: The content above represents only the views of the author or guest. It does not represent any views or positions of FOLLOWME and does not mean that FOLLOWME agrees with its statement or description, nor does it constitute any investment advice. For all actions taken by visitors based on information provided by the FOLLOWME community, the community does not assume any form of liability unless otherwise expressly promised in writing.
FOLLOWME Trading Community Website: https://www.followme.com


Hot
No comment on record. Start new comment.