EUR/USD Price Analysis: Climbs back above 1.0700, prints minimal gains

- EUR/USD edges up to 1.0708, forming a bullish 'tweezers bottom' pattern, yet still below the crucial 200-day moving average at 1.0802.
- The currency pair maintains a neutral stance with a slight bullish tilt, trapped within a 'bearish flag' pattern on the daily chart.
- Resistance and support levels are set at 1.0758 and the 38.2% Fibonacci level at 1.0654, respectively, as the pair navigates through pivotal technical junctures.
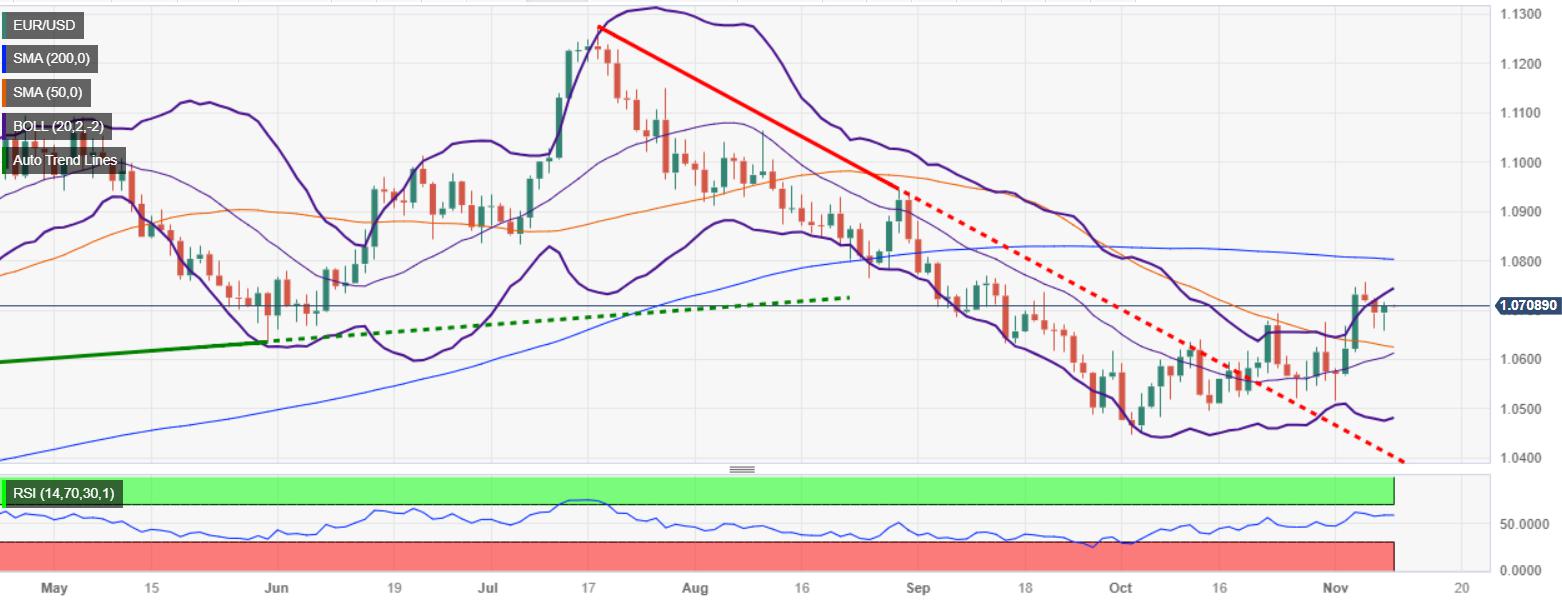
EUR/USD turns positive late on Wednesday's North American session, but it remains shy of reclaiming the 200-day moving average (DMA) at 1.0802, seen as the next resistance level for buyers. The pair is trading at 1.0708, after forming a ‘tweezers bottom’ chart pattern, with bullish implications.
The daily chart portrays the pair is neutrally biased, though slightly tilted to the upside, but within the boundaries of a ‘bearish flag.’ On November 6, despite breaching the top of the flag, the EUR/USD finished the session offered, forming an inverted hammer, suggesting the EUR/USD could resume downwards. Even though the pair printed a three-day low of 1.0659, it failed to breach support at the 38.2% Fibonacci level of the Fibonacci retracement drawn from the November 1 low to the November 6 swing high, keeping buyers hopeful of higher prices.
Key resistance levels lie at 1.0758, November’s 6 high, followed by the 200-DMA at 1.0802. On the flip side, the first support is seen at the 38.2% Fibonacci level at 10.654, followed by the confluence of the 50-DMA and the 50% Fibo retracement at 1.0624/35.
EUR/USD Price Analysis – Daily Chart
EUR/USD Technical Levels
Reprinted from FXStreet_id,the copyright all reserved by the original author.
Disclaimer: The content above represents only the views of the author or guest. It does not represent any views or positions of FOLLOWME and does not mean that FOLLOWME agrees with its statement or description, nor does it constitute any investment advice. For all actions taken by visitors based on information provided by the FOLLOWME community, the community does not assume any form of liability unless otherwise expressly promised in writing.
FOLLOWME Trading Community Website: https://www.followme.com


Hot
No comment on record. Start new comment.