Silver Price Analysis: XAG/USD clears losses, driven by lower US yields

- XAG/USD found support at a low of around $22.30 and then increased towards $22.65.
- After recovering on Monday, US Treasuries resumed their downfall.
- A strong USD limits the upside.
In Tuesday's session, the Silver spot price XAG/USD cleared most of its daily losses after bottoming at a low of $22.30 and then jumping back to $22.65. There were no relevant highlights during the session, and the metal's price dynamics were set by falling US yields, which benefited the metal.
In line with that, the 2,5 and 10-year yields declined to 4.90%, 4.52% and 4.54% but remained at lows of over a month. Those rates seem to be reflecting dovish bets on the Federal Reserve (Fed) after last week's decision, where markets perceived hints of the bank approaching the end of its tightening cycle. In addition, weak Nonfarm Payrolls figures reported on Friday exacerbated the decline, which benefited further the price of the non-yielding metal.
Markets focus shifts to next week's inflation data from the US, where markets expect the Consumer Price Index (CPI) to have decelerated in October. In that sense, soft figures may trigger further dovish bets on the Fed, which could weaken the US Dollar and fuel the price of Silver. As for now, the CME FedWatch tool indicates that the odds of a 25 bps hike in the Fed's next December meeting declined to nearly 10%.
XAG/USD Levels to watch
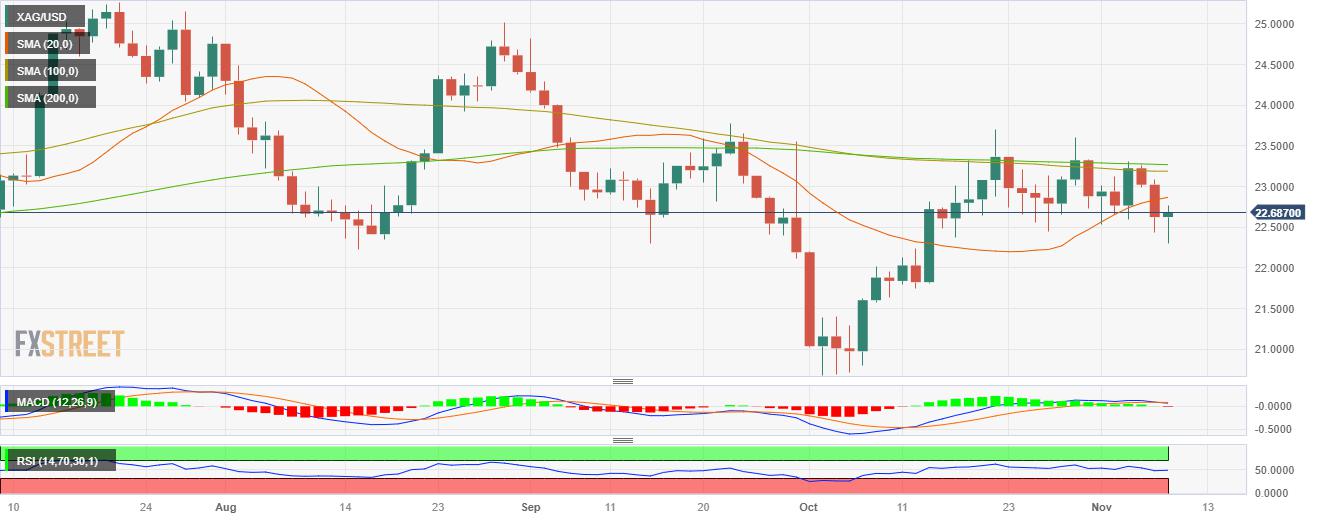
Upon analyzing the daily chart, bearish sentiment is evident for the short term for the XAG/USD. Relative Strength Index (RSI) resides below its midline in negative territory, exhibiting a southward trajectory which aligns with a negative indication from the Moving Average Convergence Divergence (MACD), as shown by the presence of red bars, underscoring the growing bearish momentum. On the other hand, the pair is below the 20,100 and 200-day Simple Moving Averages (SMAs), highlighting the continued dominance of bears on the broader scale, requiring the buyers to take action. That being said, fundamentals could revive the bullish momentum in case it aligns with the dovish Fed rhetoric.
Support levels: $22.30, $22.15, $22.00.
Resistance levels: $22.85 (20-day SMA), $23.15-30 (100 and 200-day SMA convergence), $23.50.
XAG/USD Daily Chart
Reprinted from FXStreet_id,the copyright all reserved by the original author.
Disclaimer: The content above represents only the views of the author or guest. It does not represent any views or positions of FOLLOWME and does not mean that FOLLOWME agrees with its statement or description, nor does it constitute any investment advice. For all actions taken by visitors based on information provided by the FOLLOWME community, the community does not assume any form of liability unless otherwise expressly promised in writing.
FOLLOWME Trading Community Website: https://www.followme.com


Hot
No comment on record. Start new comment.