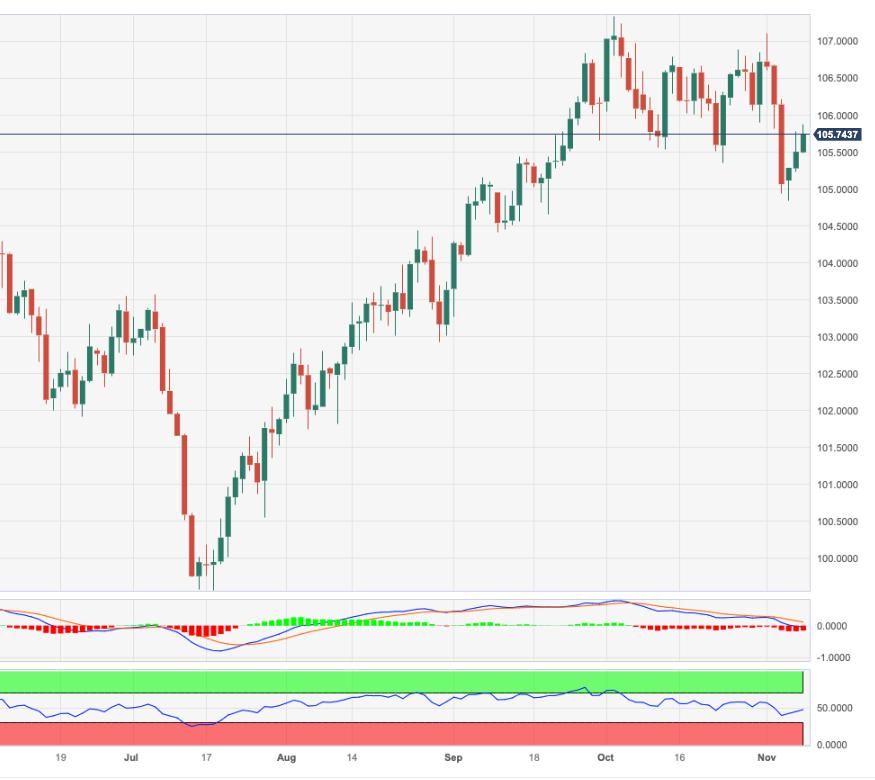
USD Index Price Analysis: Extra gains appear in store near term

- DXY extends the upside momentum near 106.00.
- Further up comes the weekly top past the 107.00 barrier.
DXY climbs to the vicinity of the 106.00 region amidst the positive price action so far this week.
In case the buying interest gathers extra pace, the index could revisit the so far November high at 107.11 (November 1) ahead of the 2023 peak of 107.34 (October 3).
In the meantime, while above the key 200-day SMA, today at 103.55, the outlook for the index is expected to remain constructive.
DXY daily chart
Reprinted from FXStreet_id,the copyright all reserved by the original author.
Disclaimer: The content above represents only the views of the author or guest. It does not represent any views or positions of FOLLOWME and does not mean that FOLLOWME agrees with its statement or description, nor does it constitute any investment advice. For all actions taken by visitors based on information provided by the FOLLOWME community, the community does not assume any form of liability unless otherwise expressly promised in writing.
FOLLOWME Trading Community Website: https://www.followme.com


Hot
No comment on record. Start new comment.