Silver Price Analysis: XAG/USD drifts lower in a multi-week-old trading range, below 200-day SMA

- Silver remains under some selling pressure for the second successive day on Tuesday.
- The formation of a rectangle points to indecision over the next leg of a directional move.
- The technical setup favours bearish traders and supports prospects for additional losses.
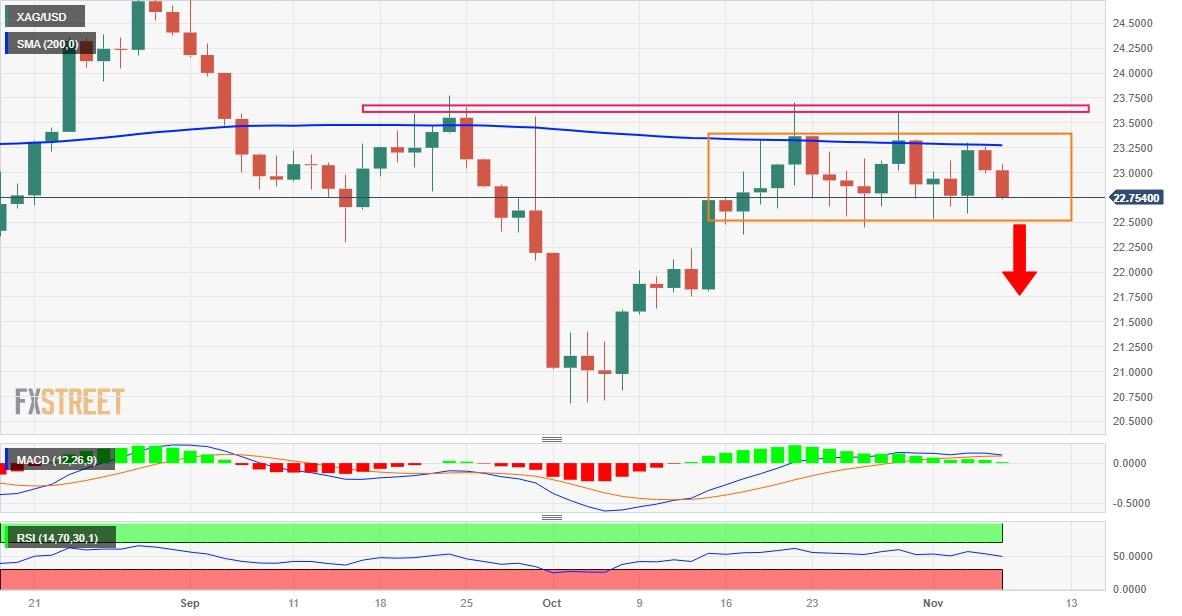
Silver (XAG/USD) extends the previous day's rejection slide from the very important 200-day Simple Moving Average (SMA) and continues losing ground for the second successive day on Tuesday. The downward trajectory picks up pace during the early part of the European session and drags the white metal to a two-day low, around the $22.75-$22.70 region in the last hour.
Looking at the broader picture, the XAG/USD has been oscillating in a familiar range over the past three weeks or so, forming a rectangle on the daily chart. This, in turn, points to indecision among traders over the next leg of a directional move. That said, the recent repeated failures to find acceptance above a technically significant 200-day SMA and rejections near the $23.60-$23.70 supply zone favour bearish traders.
Moreover, technical indicators on the daily chart have again started gaining negative traction, suggesting that the path of least resistance for the XAG/USD is to the downside. That said, it will still be prudent to wait for some follow-through selling below the $22.50 support zone before positioning for additional losses. The XAG/USD might then accelerate the fall to the $22.00 mark before dropping to the $21.70 horizontal support zone.
The downward trajectory could get extended further and drag the XAG/USD to the next relevant support near the $21.35-$21.30 region en route to the $21.00 mark. Bearish traders might then aim to challenge a seven-month low, around the $20.70-$20.65 area touched in October.
On the flip side, the $23.00 mark now seems to cap the immediate upside ahead of the 200-day SMA, currently pegged near the $23.25 region. This is followed by the $23.60-$23.70 supply zone, which should act as a key pivotal point for short-term traders. A sustained breakout through will negate the negative outlook and shift the near-term bias in favour of bullish traders, paving the way for a move towards the $24.00 mark.
Some follow-through buying has the potential to lift the XAG/USD beyond the $24.20-$24.25 intermediate resistance and make a fresh attempt to conquer the $25.00 psychological mark.
Silver daily chart
Technical levels to watch
Reprinted from FXStreet_id,the copyright all reserved by the original author.
Disclaimer: The content above represents only the views of the author or guest. It does not represent any views or positions of FOLLOWME and does not mean that FOLLOWME agrees with its statement or description, nor does it constitute any investment advice. For all actions taken by visitors based on information provided by the FOLLOWME community, the community does not assume any form of liability unless otherwise expressly promised in writing.
FOLLOWME Trading Community Website: https://www.followme.com


Hot
No comment on record. Start new comment.