GBP/USD Price Analysis: Remains capped below the 1.2200 barrier

- GBP/USD gains momentum below the 1.2200 barrier post-Fed meeting.
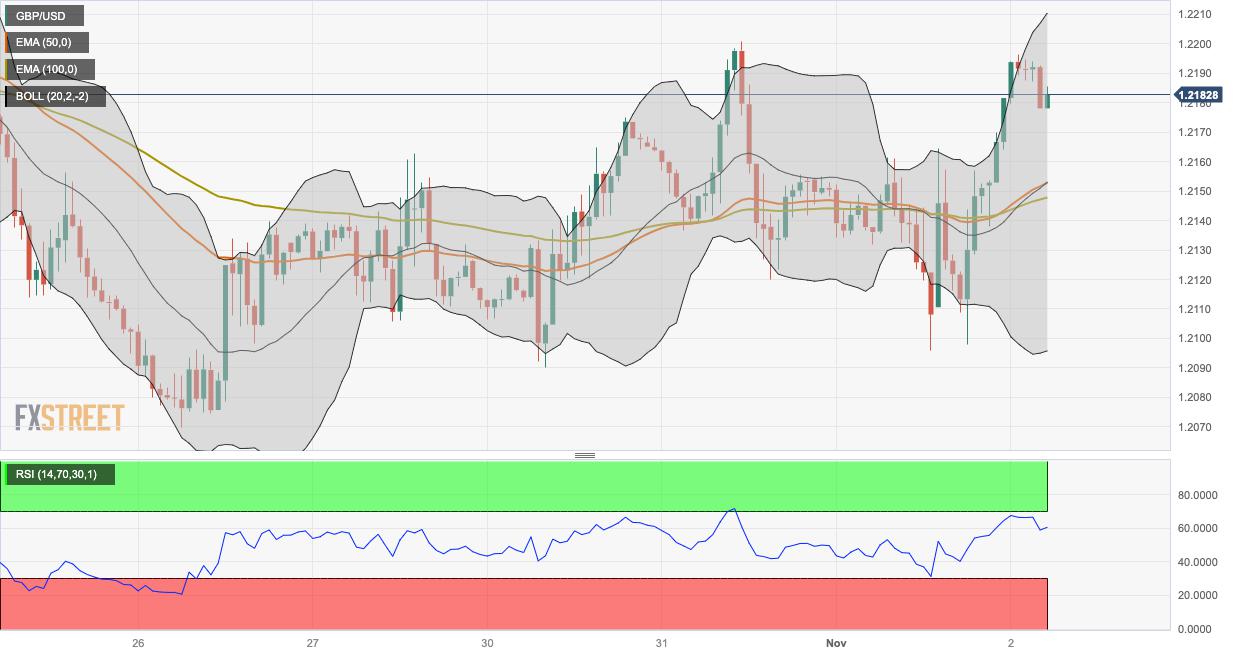
- The pair holds above the 50- and 100-hour EMAs, RSI indicator stands in the bullish zone.
- The key resistance level to watch is the 1.2200–1.2210 region; 1.2147 acts as an initial support level.
The GBP/USD pair edges higher during the Asian trading hours on Thursday. The uptick of the pair is supported by the weakening of the US Dollar (USD) after the Federal Reserve (Fed) maintained the interest rate steady, while odds that it may not hike rates again rose after the press conference. The major pair currently trades around 1.2184, gaining 0.28% on the day.
From the technical perspective, GBP/USD holds above the 50- and 100-hour Exponential Moving Averages (EMAs) on the one-hour chart, which means further upside looks favorable. Additionally, the Relative Strength Index (RSI) holds above 50 in bullish territory, indicating buyers retain control for the time being.
The critical resistance level will emerge at the 1.2200–1.2210 region, portraying the confluence of a psychological round mark, the upper boundary of the Bollinger Band, and a low of October 31. A break above the latter will see a rally to a high of October 16 at 1.2218. The additional upside filter to watch is 1.2288 (high of October 24), followed by 1.2300 (round figure).
On the flip side, the initial contention level is located near the 100-hour EMA at 1.2147. Further south, the next downside stop is seen near a low of October 31 at 1.2119. The key support level will emerge at the 1.2095–1.2100 area, representing a round mark, the lower limit of the Bollinger Band, and a low of October 20. A breach of the level will see a drop to a low of October 26 at 1.2066.
GBP/USD one-hour chart
Reprinted from FXStreet_id,the copyright all reserved by the original author.
Disclaimer: The content above represents only the views of the author or guest. It does not represent any views or positions of FOLLOWME and does not mean that FOLLOWME agrees with its statement or description, nor does it constitute any investment advice. For all actions taken by visitors based on information provided by the FOLLOWME community, the community does not assume any form of liability unless otherwise expressly promised in writing.
FOLLOWME Trading Community Website: https://www.followme.com


Hot
No comment on record. Start new comment.