USD/JPY Price Analysis: Remains above 151.00 post retreating from a yearly high

- USD/JPY could revisit the yearly high at 151.72 on a stronger US Dollar.
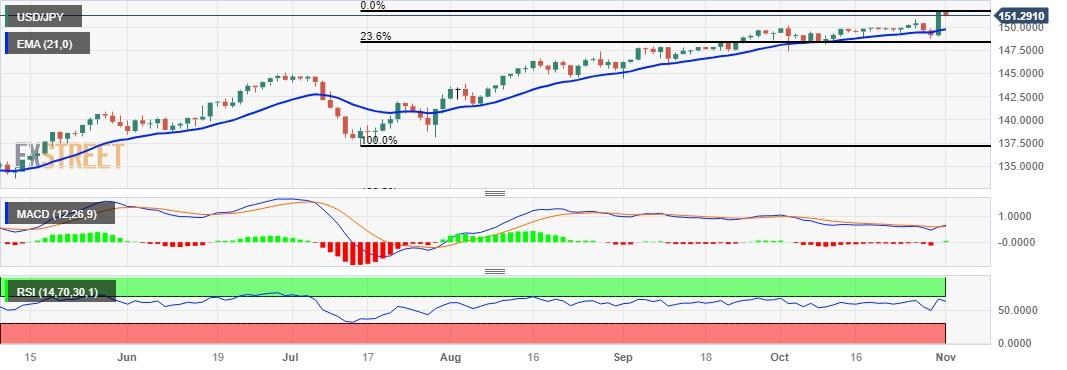
- Key support emerges at 151.00 major level following the 21-day EMA.
- Technical indicators suggest bullish momentum for the pair.
USD/JPY consolidates near 151.20 during the European session on Wednesday, pulling back from the recent yearly high of 151.72 reached on Tuesday. The pair surged after the Bank of Japan (BoJ) scrapped the 1% ceiling for the 10-year government bond yield.
The immediate support at 151.00 comes into play, with the 21-day Exponential Moving Average (EMA) at 149.76 serving as the next support level. A decisive break below the latter could open the door for USD/JPY bears to target the 23.6% Fibonacci retracement around 148.28.
The unexpected decrease in China's Caixin Manufacturing Purchasing Managers' Index (PMI) could contribute to the pressure on the Japanese Yen (JPY). The report printed a figure of 49.5 in October, falling below the expected 50.8 and September's expansion at 50.6.
The Moving Average Convergence Divergence (MACD) line's position above the centerline and the signal line suggests a potential bullish momentum. Furthermore, the 14-day Relative Strength Index (RSI) above the 50 level indicates a favorable market sentiment, supporting the notion of bullish momentum for the USD/JPY pair.
On the upside, the USD/JPY could face resistance near the highs marked in October 2022 at 151.94, which is lined up with a 152.00 psychological level.
USD/JPY: Daily Chart
Reprinted from FXStreet_id,the copyright all reserved by the original author.
Disclaimer: The content above represents only the views of the author or guest. It does not represent any views or positions of FOLLOWME and does not mean that FOLLOWME agrees with its statement or description, nor does it constitute any investment advice. For all actions taken by visitors based on information provided by the FOLLOWME community, the community does not assume any form of liability unless otherwise expressly promised in writing.
FOLLOWME Trading Community Website: https://www.followme.com


Hot
No comment on record. Start new comment.