USD/JPY Price Analysis: 100-hour SMA near 150.00 holds the key for bulls ahead of US PCE data

- USD/JPY meets with some supply on Friday and snaps a three-day winning streak to the YTD top.
- Intervention fears benefit the JPY and exert pressure on the pair amid subdued USD price action.
- The divergent Fed-BoJ policy outlook should limit the downside ahead of the US PCE Price Index.
The USD/JPY pair edges lower during the Asian session on Friday and for now, seems to have snapped a three-day winning streak to its highest level since October 2022, around the 150.75-150.80 region touched the previous day. Spot prices, however, manage to hold above the 150.00 psychological mark as traders keenly await the US PCE Price Index before positioning for the next leg of a directional move.
In the meantime, speculations that the Japanese government will intervene in FX markets to stem any further weakness in the Japanese Yen (JPY) exert some pressure on the USD/JPY pair amid subdued US Dollar (USD) price action. That said, a big divergence in the monetary policy stance adopted by the Federal Reserve (Fed) and the Bank of Japan (BoJ) should help limit the downside. Investors might also refrain from placing aggressive bets ahead of next week's central bank event risks – the BoJ meeting on Tuesday, followed by the crucial FOMC decision on Wednesday.
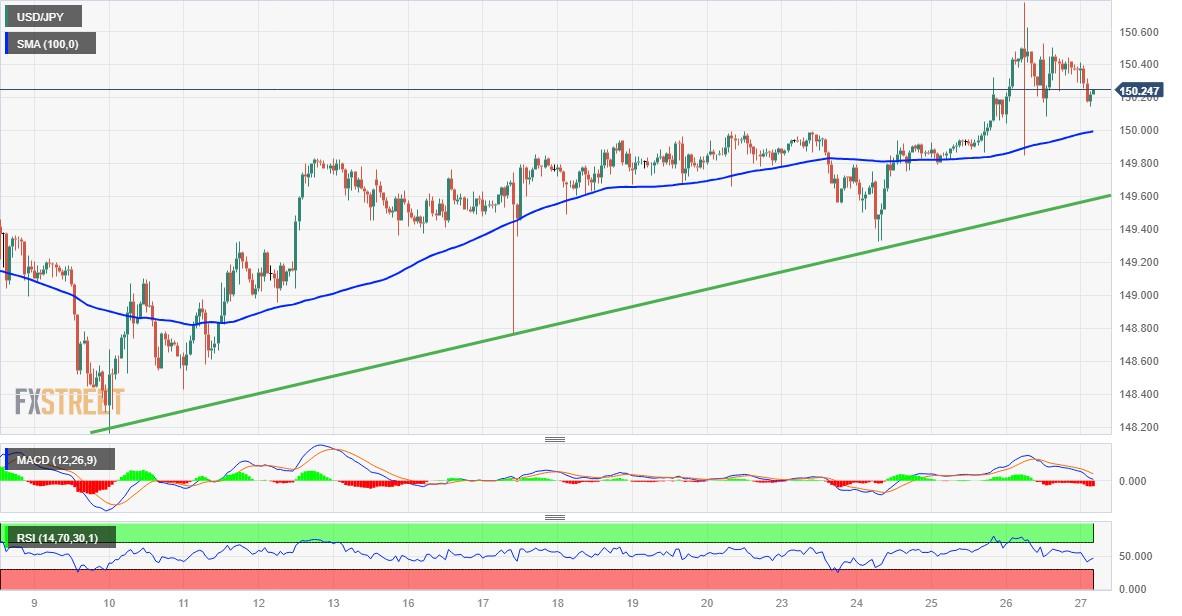
From a technical perspective, the overnight intraday downfall showed some resilience below the 100-hour Simple Moving Average (SMA). The said support, currently pegged around the 150.00 mark, should now act as a pivotal point for intraday traders, below which the USD/JPY pair could accelerate the slide towards an ascending trend-line support near the 149.65 area. Some follow-through selling will be seen as a fresh trigger for bearish traders and pave the way for a slide towards the 149.30 intermediate support before spot prices drop to the 149.00 round figure.
The downward trajectory could get extended further towards the next relevant support near the 148.70 region en route to the 148.25 horizontal zone and the 148.00 mark. The USD/JPY pair could eventually fall to the 147.30-147.25 region, or the monthly swing low touched on October 3.
On the flip side, the YTD peak, around the 150.75-150.80 region touched on Thursday, now seems to act as an immediate hurdle ahead of the 151.00 mark. Some follow-through buying has the potential to push the USD/JPY pair closer to the 152.00 mark, or a multi-decade high touched in October 2022.
USD/JPY 1-hour chart
Technical levels to watch
Reprinted from FXStreet_id,the copyright all reserved by the original author.
Disclaimer: The content above represents only the views of the author or guest. It does not represent any views or positions of FOLLOWME and does not mean that FOLLOWME agrees with its statement or description, nor does it constitute any investment advice. For all actions taken by visitors based on information provided by the FOLLOWME community, the community does not assume any form of liability unless otherwise expressly promised in writing.
FOLLOWME Trading Community Website: https://www.followme.com


Hot
No comment on record. Start new comment.