AUD/NZD Price Analysis: At risk of losing bullish momentum beyond 1.0860

- The AUD/NZD is seeing downside play after peaking near 1.0920 in the mid-week.
- The pair has rallied from a low near 1.0640, but topside momentum appears to have emptied the tank.
- Aussie-Kiwi prices are set to continue cycling the 200-day SMA with a lack of long-term momentum.
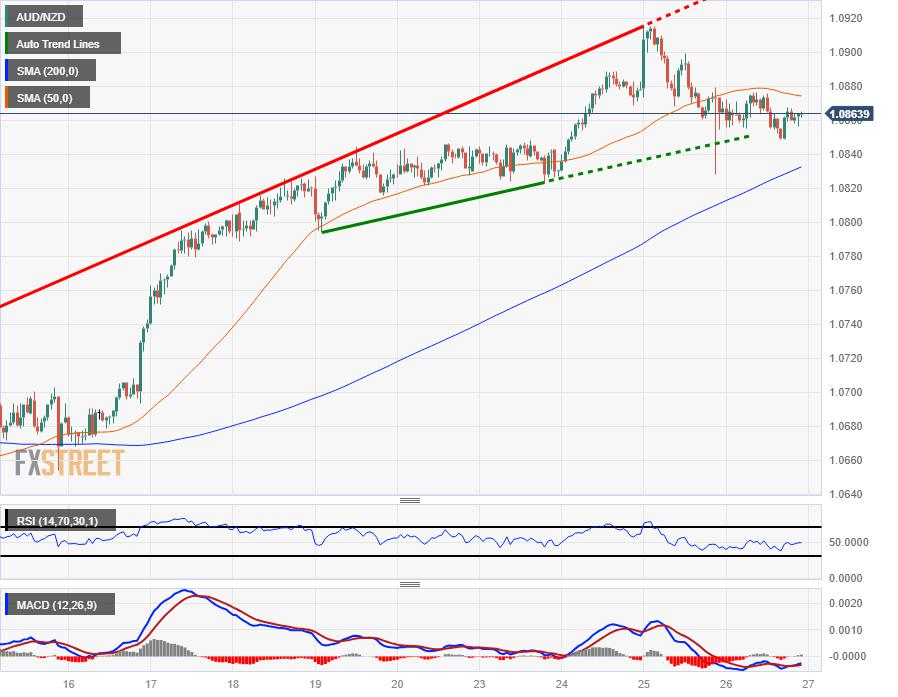
The AUD/NZD is trading into 1.0860 after Thursday's market session saw the pair pull back towards the 200-day Simple Moving Average (SMA), tipping into a daily low of 1.0828 as the recent bullish upswing runs out of momentum.
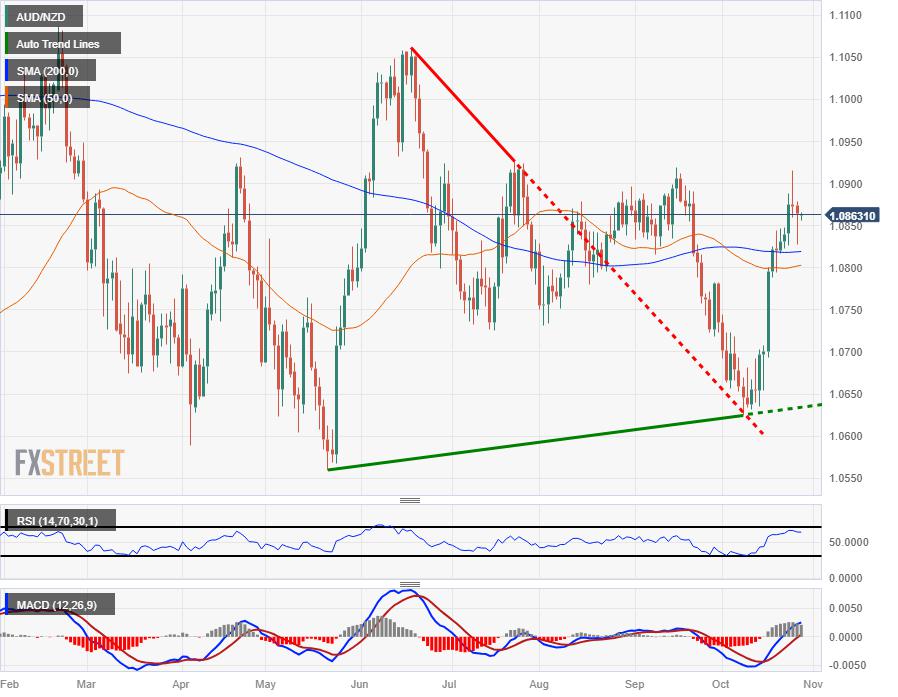
The pair hit a one-month high of 1.0915 on Wednesday after rebounding 2.75% from October's low near 1.0620.
The AUD/NZD has been steadily cycling the 200-day SMA for the majority of the year as the Aussie (AUD) and the Kiwi (NZD) battle it out for supremacy, with neither Antipodean gaining a firm technical foothold on the other.
The Relative Strength Index (RSI) is beginning to rotate downwards once more after losing momentum just shy of the signal line for overbought technical conditions, and the pair could be ripe for a late-stage bullish extension if Aussie traders find new data to chew on.
On the low side, the 50-day SMA continues to consolidate near the 200-day SMA, implying recent moves only had a temporary momentum effect, and the pair is set to see a return to chart paper near 1.0750.
AUD/NZD Hourly Chart
AUD/NZD Daily Chart
AUD/NZD Technical Levels
Reprinted from FXStreet_id,the copyright all reserved by the original author.
Disclaimer: The content above represents only the views of the author or guest. It does not represent any views or positions of FOLLOWME and does not mean that FOLLOWME agrees with its statement or description, nor does it constitute any investment advice. For all actions taken by visitors based on information provided by the FOLLOWME community, the community does not assume any form of liability unless otherwise expressly promised in writing.
FOLLOWME Trading Community Website: https://www.followme.com


Hot
No comment on record. Start new comment.