NZD/USD Price Analysis: Struggles near 0.5800, rebounds from a 11-month low

- NZD/USD pulls back from a 11-month low at 0.5773.
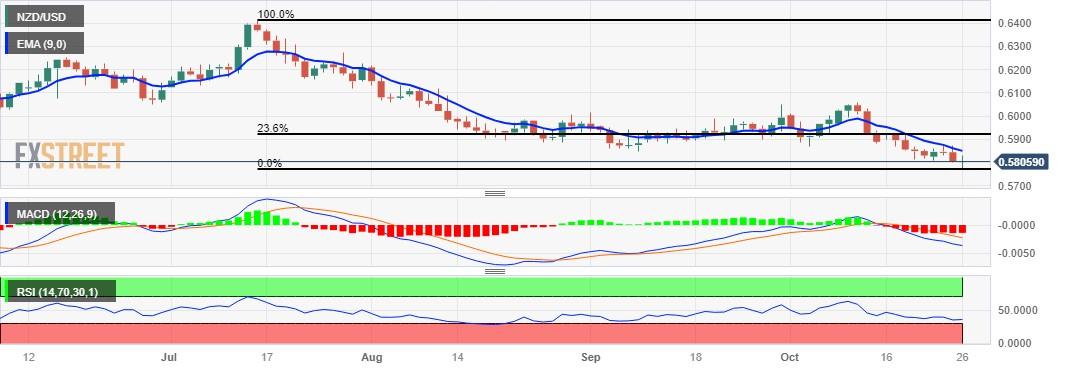
- The pair inclines toward the weaker sentiment suggested by the technical indicators.
- Nine-day EMA appears to be the barrier lined up with the 0.5850 psychological level.
NZD/USD dropped to a 11-month low at 0.5773 on Thursday. However, the pair has retraced the daily losses during the European session, struggling to halt a two-day losing streak.
The Moving Average Convergence Divergence (MACD) line persists below both the centerline and the signal line, setting a bearish tone for the NZD/USD pair, as echoed by market sentiment. Investors will likely watch the Kiwi’s Consumer Confidence on Friday, a key indicator for gauging sentiment and economic outlook.
The pair trades around the 0.5800 psychological level followed by the nine-day Exponential Moving Average (EMA) at 0.5849, which emerges as the key resistance lined up with the 0.5850 major level.
A firm break above the level could contribute support for the NZD/USD pair to explore the next psychological region around 0.5900 level following the 23.6% Fibonacci retracement at 0.5920.
On the downside, the region around the intraday low could act again as the immediate support followed by November’s low at 0.5740.
Furthermore, the NZD/USD duo reveals a subdued momentum, with the 14-day Relative Strength Index (RSI) showcasing a clear inclination towards weakness, dipping below the 50 level.
NZD/USD: Daily Chart
Reprinted from FXStreet_id,the copyright all reserved by the original author.
Disclaimer: The content above represents only the views of the author or guest. It does not represent any views or positions of FOLLOWME and does not mean that FOLLOWME agrees with its statement or description, nor does it constitute any investment advice. For all actions taken by visitors based on information provided by the FOLLOWME community, the community does not assume any form of liability unless otherwise expressly promised in writing.
FOLLOWME Trading Community Website: https://www.followme.com


Hot
No comment on record. Start new comment.