USD Index Price Analysis: Next on the upside comes 106.80

- DXY gathers extra steam north of the 106.00 hurdle.
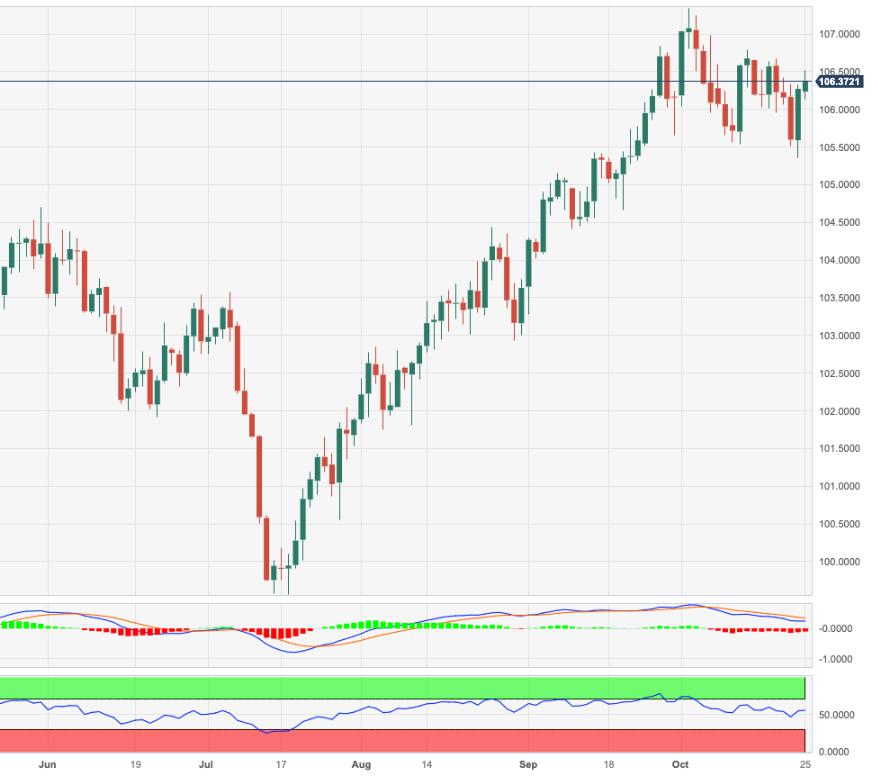
- Extra advances could see the 106.80 area revisited.
DXY extends the weekly recovery to the mid-106.00s, or multi-day peaks, on Wednesday.
It seems the index keeps trading within a consolidative phase for the time being. The continuation of the upward trend, in the meantime, continue to target the weekly top of 106.78 (October 12) ahead of the 2023 high of 107.34 (October 3).
So far, while above the key 200-day SMA, today at 103.34, the outlook for the index is expected to remain constructive.
DXY daily chart
Reprinted from FXStreet_id,the copyright all reserved by the original author.
Disclaimer: The content above represents only the views of the author or guest. It does not represent any views or positions of FOLLOWME and does not mean that FOLLOWME agrees with its statement or description, nor does it constitute any investment advice. For all actions taken by visitors based on information provided by the FOLLOWME community, the community does not assume any form of liability unless otherwise expressly promised in writing.
FOLLOWME Trading Community Website: https://www.followme.com


Hot
No comment on record. Start new comment.