NZD/USD Price Analysis: Hovers near 0.5850 followed by nine-day EMA barrier

- NZD/USD looks to extend losses due to the stronger US Dollar.
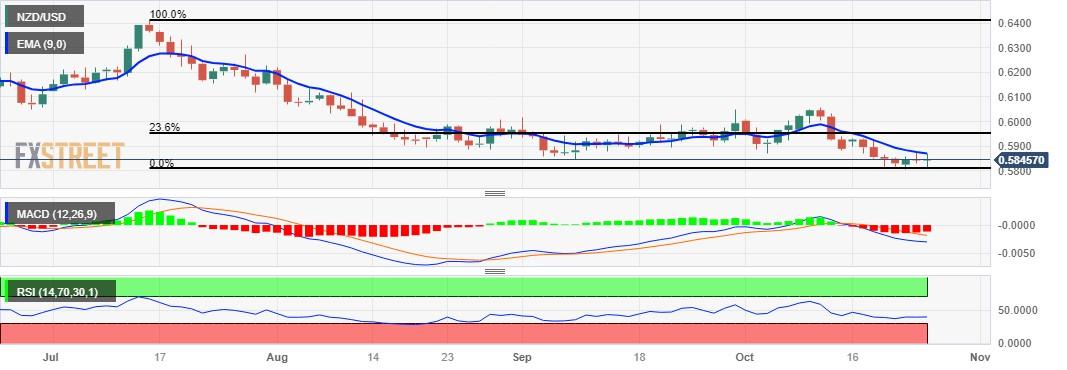
- Technical indicators suggest a bearish sentiment in the pair.
- Major level at 0.5800 aligned with the monthly low could act again as support.
NZD/USD struggles to remain in the positive territory after minor losses registered in the previous session due to weaker upbeat S&P Global PMI from the United States (US).
US S&P Global Composite PMI showed growth in October, rising from 50.2 to 51.0. The Services PMI experienced an increase, reaching 50.9, while the Manufacturing PMI rose to 50.0. The manufacturing index has maintained a level above the 50-point threshold in the last six months, indicating a positive shift in that sector.
NZD/USD trades around the 0.5850 psychological level during the European session on Wednesday. The pair has almost trimmed its intraday gains as the US Dollar (USD) continues the gains for the second successive day.
The nine-day Exponential Moving Average (EMA) at 0.5870 appears to be the key barrier, followed by the 0.5900 psychological level.
A firm break above the latter could open the doors for the NZD/USD pair to explore the region around the 23.6% Fibonacci retracement at 0.5950.
On the downside, the region around the major level at 0.5800 aligned with the monthly low at 0.5807 could act again as the immediate support for the NZD/USD pair.
The Moving Average Convergence Divergence (MACD) line remains beneath both the centerline and the signal line. The financial sonnet echoes a bearish refrain for the NZD/USD pair.
Furthermore, the NZD/USD pair unveils a bearish momentum, as the 14-day Relative Strength Index (RSI) flaunts a palpable penchant for weakness, gracefully bowing beneath the 50 level.
NZD/USD: Daily Chart
Reprinted from FXStreet_id,the copyright all reserved by the original author.
Disclaimer: The content above represents only the views of the author or guest. It does not represent any views or positions of FOLLOWME and does not mean that FOLLOWME agrees with its statement or description, nor does it constitute any investment advice. For all actions taken by visitors based on information provided by the FOLLOWME community, the community does not assume any form of liability unless otherwise expressly promised in writing.
FOLLOWME Trading Community Website: https://www.followme.com


Hot
No comment on record. Start new comment.