AUD/USD rebounds into 0.6350

- The AUD/USD is stepping up on broad Greenback weakness on Monday.
- This week has a rolling table of PMI and CPI inflation figures.
- AUD strength still leans heavily on broad-market Dollar Index weakness.
The Australian Dollar (AUD) caught a bounce from 0.6300 against the US Dollar (USD) in Monday's trading, rallying into 0.6350. The AUD/USD opened up the trading week near 0.6314, sagging into 0.6288 before catching a bid on broad-market Greenback weakness.
AUD/USD to drift higher over coming year, reaching 0.73 by end-2024 – NAB
Late Monday at 22:00 GMT sees Australian Purchasing Manager Index (PMI) numbers as the Pacific markets head into the early Tuesday trading window, but Aussie traders will be keeping their eyes turned forward, looking ahead to Wednesday's Australian Consumer Price Index (CPI) inflation print.
On Tuesday, the USD side sees US PMIs, and investors are broadly anticipating a mild downtick in the manufacturing and services components; US Manufacturing PMI is seen declining from 49.8, with the Services component likewise expected to decline from 50.1 to 49.9.
The annualized Australian Monthly Consumer Price Index (CPI) last printed at 5.2%, and markets are forecasting an uptick in CPI inflation on Wednesday, with the index expected to increase 5.4% for the year into September.
AUD/USD Technical Outlook
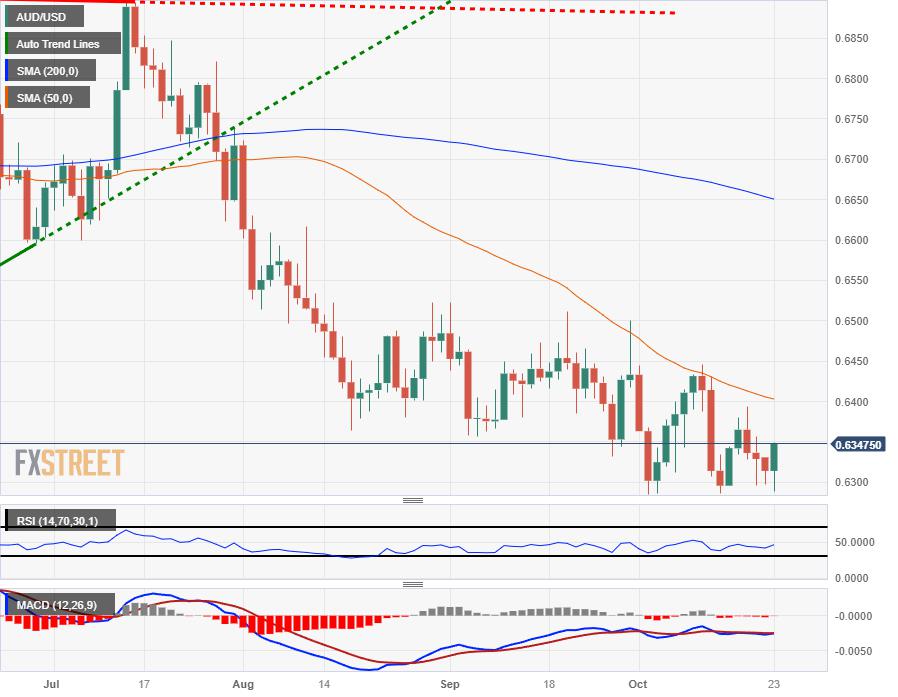
Despite Monday's bounce, the Aussie remains woefully bearish against the US Dollar in the near term, with the pair still trading below last week's highs and sticking close to eleven-month lows.
Technical resistance continues to press down on prices from a descending 50-day Simple Moving Average currently settling into the 0.6400 handle, with October's lows below 0.6300 serving as the only meaningful support for current price action.
AUD/USD Daily Chart
AUD/USD Technical Levels
Reprinted from FXStreet_id,the copyright all reserved by the original author.
Disclaimer: The content above represents only the views of the author or guest. It does not represent any views or positions of FOLLOWME and does not mean that FOLLOWME agrees with its statement or description, nor does it constitute any investment advice. For all actions taken by visitors based on information provided by the FOLLOWME community, the community does not assume any form of liability unless otherwise expressly promised in writing.
FOLLOWME Trading Community Website: https://www.followme.com


Hot
No comment on record. Start new comment.