EUR/JPY Price Analysis: Uptrend stalls at 159.00, as buyers target 159.70s YTD high

- EUR/JPY climbs for the second straight day, breaking above 158.92, but closes at 158.74.
- BoJ's ultra-loose monetary policy pressures JPY, while positive EU data reduces a possible ECB rate hike.
- Technical analysis shows potential for further gains, with YTD high at 159.76 as next target for buyers.
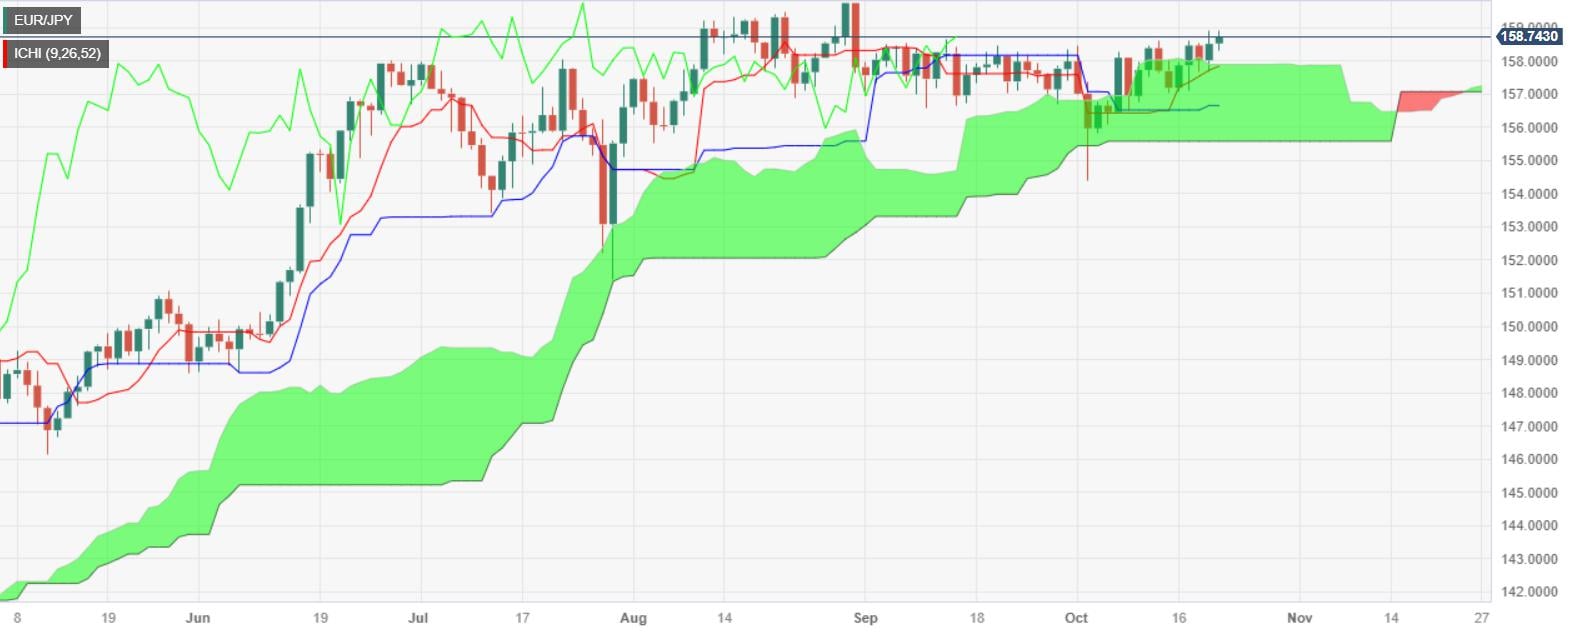
EUR/JPY climbed for the second straight day, breaking above last Thursday’s high of 158.92, though it retreated some and printed a daily close of 158.74, registering gains of 0.19%.
The fundamental backdrop has not changed, as risk aversion was the price action driver during the week, while the Bank of Japan’s (BoJ) commitment to its ultra-loose monetary policy pressured the Japanese Yen (JPY). Meanwhile, the Eurozone’s (EU) more positive economic data has pushed aside the likelihood of a European Central Bank (ECB) rate hike, but the Euro (EUR) is not out of the woods yet. Recessionary fears loom, along with inflation twice the ECB’s target, increased speculations for a stagflationary scenario.
From a technical perspective, the EUR/JPY’s lack of clear direction keeps the pair trading sideways, though slightly tilted to the upside. If the cross-pair breaks above 159.00, buyers could test the year-to-date (YTD) high at 159.76.
Conversely, if EUR/JPY sellers moved in, the first support would be the 158.00 figure, immediately followed by the top of the Ichimoku Cloud (Kumo) at 157.75/95. Once cleared, the cross would drip inside the Kumo, indicating sellers gathering momentum, with the next support seen at the Tenkan Sen at 157.85, followed by the Kijun-Sen at 156.64.
EUR/JPY Price Action – Daily chart
EUR/JPY Technical Levels
Reprinted from FXStreet_id,the copyright all reserved by the original author.
Disclaimer: The content above represents only the views of the author or guest. It does not represent any views or positions of FOLLOWME and does not mean that FOLLOWME agrees with its statement or description, nor does it constitute any investment advice. For all actions taken by visitors based on information provided by the FOLLOWME community, the community does not assume any form of liability unless otherwise expressly promised in writing.
FOLLOWME Trading Community Website: https://www.followme.com


Hot
No comment on record. Start new comment.