NZD/JPY falls below the 100-day SMA, towards 87.30

- NZD/USD saw 0.30% losses declining near 87.30 .
- The cross tallies a four-day losing streak and will close a 0.80% losing week.
- For the first time since April, the pair trades below the 20 and 100-day SMA.
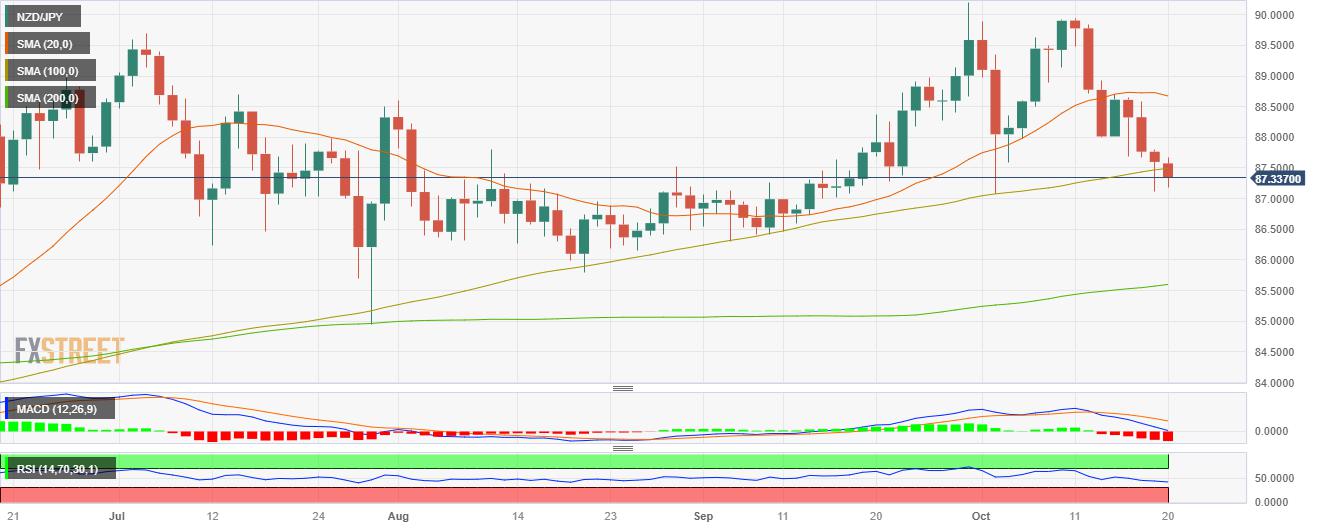
In Friday’s session, the NZD/JPY continued facing selling pressure, seeing losses for a fourth consecutive day. The bears breach the 100-day Simple Moving Average (SMA), and the outlook is starting to tilt in favour of the bears in the daily chart.The Relative Strength Index (RSI) exhibits a negative slope below the 50 threshold, approaching the oversold condition, while the Moving Average Convergence (MACD) histogram displays larger red bars. Furthermore, the pair is above the 20 and 100-day Simple Moving Averages (SMAs) but below the 200-day SMA, pointing out that the long-term trend currently favours the bulls.
The bearish sentiment is more evident on the four-hour chart, with indicators approaching oversold conditions and the RSI leaping towards the 30 area. That being said, a technical correction in the next sessions may be on the horizon, but in the short term, the sellers have the upperhand.
Support levels: 87.122, 86.505, 86.300.
Resistance levels: 87.500 (100-day SMA), 87.805, 88.300.
NZD/JPY Daily Chart
Reprinted from FXStreet_id,the copyright all reserved by the original author.
Disclaimer: The content above represents only the views of the author or guest. It does not represent any views or positions of FOLLOWME and does not mean that FOLLOWME agrees with its statement or description, nor does it constitute any investment advice. For all actions taken by visitors based on information provided by the FOLLOWME community, the community does not assume any form of liability unless otherwise expressly promised in writing.
FOLLOWME Trading Community Website: https://www.followme.com


Hot
No comment on record. Start new comment.