NZD/USD sets new low for 2023 at 0.5815 as Kiwi continues to slide

- The NZD/USD hit a new low for the year as the Kiwi loses ground against the US Dollar.
- Markets twisted following a dovish showing from Fed Chair Powell, but the Kiwi extends downside momentum.
- New Zealand Trade Balance figures failed to inspire meaningful momentum.
The NZD/USD slipped into a fresh low for 2023, declining into 0.5815 in Thursday trading before catching a soft bid back into 0.5840, but bearish pressure remains elevated for the beleaguered Kiwi (NZD).
Federal Reserve Chairman Jerome Powell hit markets with dovish comments while giving a speech at the Economic Club of New York, where the Fed head spread his bets, noting that rising yields are helping to alleviate some of the upside pressure on rates, but that inflation concerns remain elevated and the Fed seeing rate cuts on schedule is not a foregone conclusion.
Powell speech: Higher yields take some pressure off Fed to raise rates
New Zealand Trade Balance figures broadly printed close to previous, with September's headline Trade Balance printing at $-2.329B compared to August's $-2.273B, with the previous getting revised downward, albeit slightly, from $-2.291B.
NZD/USD Technical Outlook
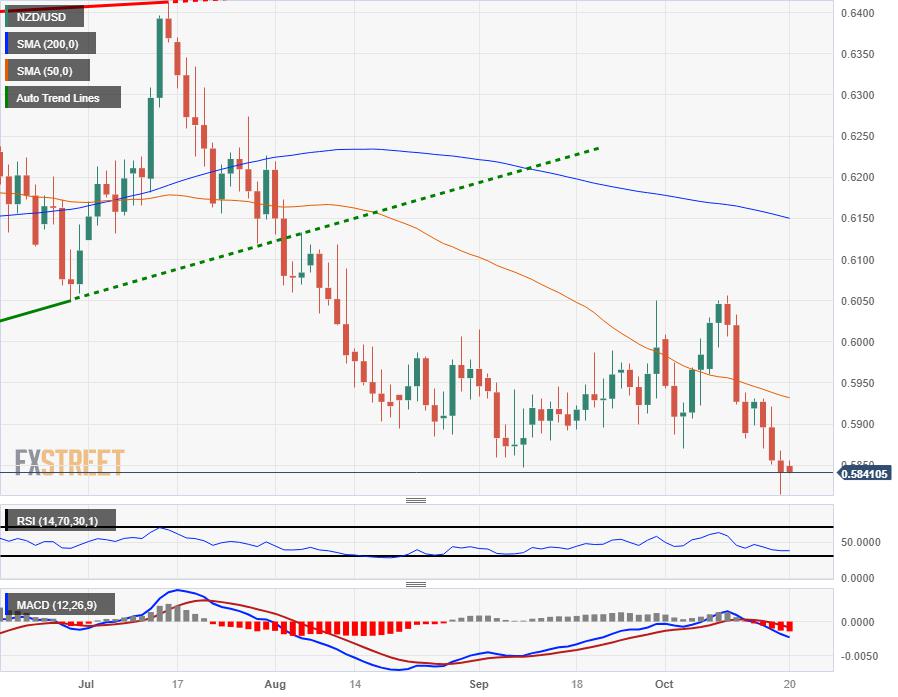
The Kiwi's latest decline from the 0.6050 level sees the NZD/USD rejected from the 50-day Simple Moving Average (SMA) near 0.5932, and settling into new lows for 2023.
With the NZD/USD trading into the downside for the year, the pair is seeing its lowest bids in eleven months, and technical support remains thin until last October's lows near 0.5550, while a bullish rebound will face resistance from the 200-day SMA near 0.6150.
NZD/USD Daily Chart
NZD/USD Technical Levels
Reprinted from FXStreet_id,the copyright all reserved by the original author.
Disclaimer: The content above represents only the views of the author or guest. It does not represent any views or positions of FOLLOWME and does not mean that FOLLOWME agrees with its statement or description, nor does it constitute any investment advice. For all actions taken by visitors based on information provided by the FOLLOWME community, the community does not assume any form of liability unless otherwise expressly promised in writing.
FOLLOWME Trading Community Website: https://www.followme.com


Hot
No comment on record. Start new comment.