GBP/JPY Price Analysis: Dips for third straight day, with bears firmly in charge

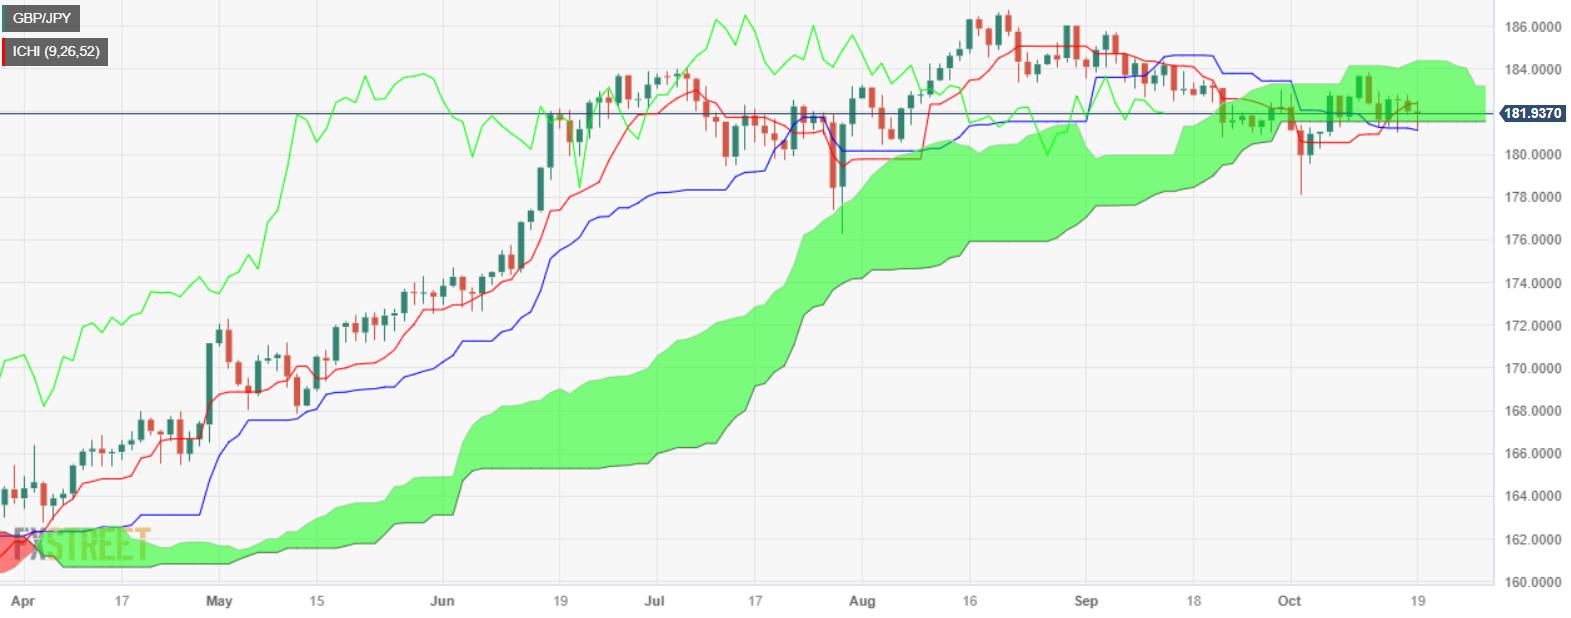
- GBP/JPY daily chart shows the pair trading near the bottom of the Ichimoku Cloud (Kumo).
- Initial support is seen at 181.50/55; clearing this could lead to tests of 18.00 and the October 3 swing low at 178.31.
- First resistance at 182.00, followed by the week's high of 182.81.
The GBP/JPY trends lower late in the New York session after hitting a daily high of 182.51, though a deterioration in sentiment spurred outflows from the Pound Sterling (GBP) toward the safe-haven status of the Japanese Yen (JPY). The cross-pair is trading at 181.98, down 0.01%.
From a technical standpoint, the GBP/JPY daily chart portrays the pair as subdued, exchanging hands inside the Ichimoku Cloud (Kumo) near the bottom of the Kumo. If the pair clears the initial support seen at 181.50/55, that will pave the way to test 18.00, followed by the October 3 swing low of 178.31. Further downside is expected at July 28 daily and the latest cycle low at 176.30.
Conversely, the GBP/JPY first resistance would be the 182.00 figure, followed by the current week’s high of 182.81. Additional upside risks are above the 183.00 mark, like the top of the Kumo at around 184.50/75.
GBP/JPY Price Action – Daily chart
GBP/JPY Technical Levels
Reprinted from FXStreet_id,the copyright all reserved by the original author.
Disclaimer: The content above represents only the views of the author or guest. It does not represent any views or positions of FOLLOWME and does not mean that FOLLOWME agrees with its statement or description, nor does it constitute any investment advice. For all actions taken by visitors based on information provided by the FOLLOWME community, the community does not assume any form of liability unless otherwise expressly promised in writing.
FOLLOWME Trading Community Website: https://www.followme.com


Hot
No comment on record. Start new comment.