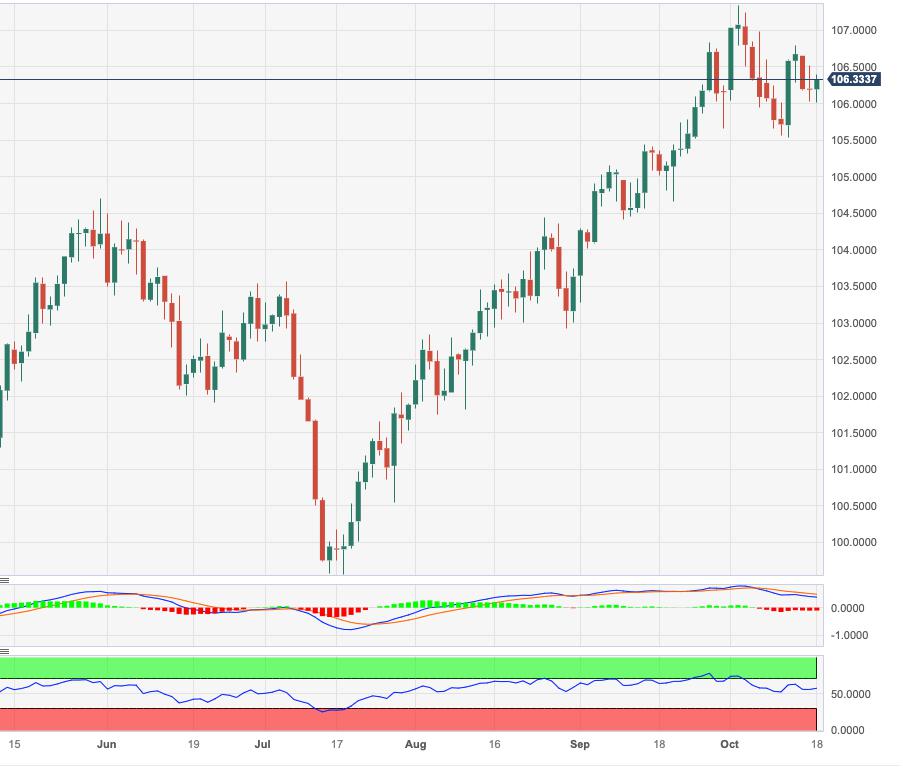
USD Index Price Analysis: Decent support emerges around 106.00

- DXY picks up upside traction and reverses two daily pullbacks in a row.
- The continuation of the rebound targets the 106.80 region.
DXY leaves behind the pessimism seen in the first half of the week and revisits the low-106.00s on Wednesday.
In case the bullish impulse accelerates, the surpass of the weekly high of 106.78 (October 12) could encourage the index to embark on a potential test of the 2023 top of 107.34 (October 3) in the short-term horizon.
In the meantime, while above the key 200-day SMA, today at 103.25, the outlook for the index is expected to remain constructive.
DXY daily chart
Reprinted from FXStreet_id,the copyright all reserved by the original author.
Disclaimer: The content above represents only the views of the author or guest. It does not represent any views or positions of FOLLOWME and does not mean that FOLLOWME agrees with its statement or description, nor does it constitute any investment advice. For all actions taken by visitors based on information provided by the FOLLOWME community, the community does not assume any form of liability unless otherwise expressly promised in writing.
FOLLOWME Trading Community Website: https://www.followme.com


Hot
No comment on record. Start new comment.