Gold Price Forecast: XAU/USD dips back into $1,920 after early Tuesday lift

- Spot Gold prices are slipping back into the middle after Tuesday saw a push above $1,930.
- XAU/USD remains well-bid, sticking to the high end of last week's rally.
- Inflation fears remain a key factor in Gold prices as investors keep one foot in safety.
XAU/USD kicked off Tuesday trading near $1,919 before seeing a steady rise into an intraday high of $1,931.65, but the day's momentum is proving short-lived as Gold bids settle back into near-term consolidation $1,920.
US Retail Sales broadly beat market estimates, with the headline figure for September printing at 0.7% versus the forecast 0.3%, with the previous period also seeing an upwards revision from 0.6% to 0.8%.
US Retail Sales rose 0.7% in September vs. 0.3% anticipated
The Retail Sales beat sent the US Dollar (USD) broadly lower against the market, giving risk assets a solid push up the charts, and while spot Gold prices saw some bullish play as investors remain concerned about a bumper US economy threatening to push the Federal Reserve (Fed) further away from anticipated rate cuts in 2024, the US Retail Sales figure isn't a solid indicator of possible inflation.
XAU/USD Technical Outlook
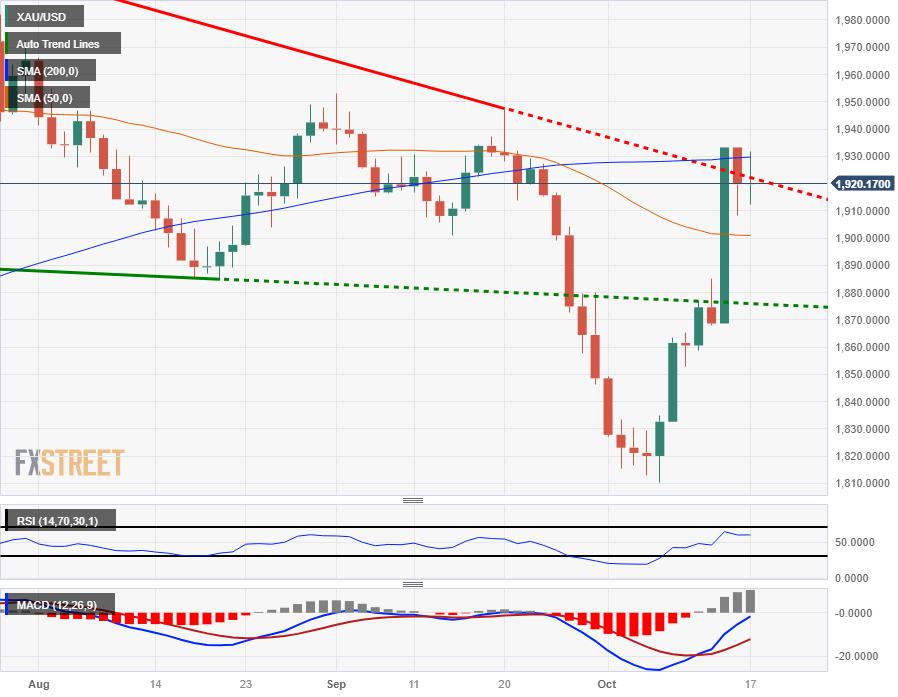
Near-term action sees spot Gold prices bidding into the 50-hour Simple Moving Average (SMA), with action hobbled near $1,920 and bidders struggling to take XAU/USD higher, while short-sellers are seeing significant headwinds with Gold prices firmly bullish and trading well above the 200-hour SMA.
Daily candlesticks see XAU/USD facing a technical rejection from the 200-hour SMA near $1,930 after a 6.8% climb from the last swing low into $1,810, and near-term technical indicators are warning of possible consolidation on the charts with a flat 50-day SMA trapping prices in the middle.
XAU/USD Daily Chart
XAU/USD Technical Levels
Reprinted from FXStreet_id,the copyright all reserved by the original author.
Disclaimer: The content above represents only the views of the author or guest. It does not represent any views or positions of FOLLOWME and does not mean that FOLLOWME agrees with its statement or description, nor does it constitute any investment advice. For all actions taken by visitors based on information provided by the FOLLOWME community, the community does not assume any form of liability unless otherwise expressly promised in writing.
FOLLOWME Trading Community Website: https://www.followme.com


Hot
No comment on record. Start new comment.