US equities catch a ride up on Monday, S&P 500 taps $4,380

- US stock indexes caught some lift on Monday, rising on improving risk appetite.
- US earnings season is underway, and investors are looking for solid expectation beats.
- Stock traders are looking for an extended rebound in stock prices.
The Standard & Poor's (S&P) 500 major equity index rose over 1% on Monday, gaining 45 points to close at $4,373.63. Other major US indexes faired equally well, with the Dow Jones Industrial Average (DJIA) rising 0.93%, climbing almost 315 points to close at $33,984.54. The NASDAQ Composite index also gained 1.2%, lifting 160.75 points to end Monday at $13,567.98.
Wall Street is looking ahead with hopes of broad beats with over 50 companies, or 11% of the S&P index reporting summer profits this week. Investors will be looking for signs that growth in the US economy is firming up, and notable earnings reports this week include Bank of America, Tesla, Netflix, and Johnson & Johnson.
Markets have broadly shrugged off last week's risk-off flows sparked by the latest escalation of the Israel-Hammas conflict, though tensions around the Middle East remain in the undercurrent, with energies struggling to shake off concerns about geopolitical tensions threatening the safety and relative calm of the Strait of Hormuz. Nearly a fifth of all global fossil fuel trade passes through the chokepoint, and a ramping up of tensions in the region could see global trade stifled.
S&P 500 Technical Outlook
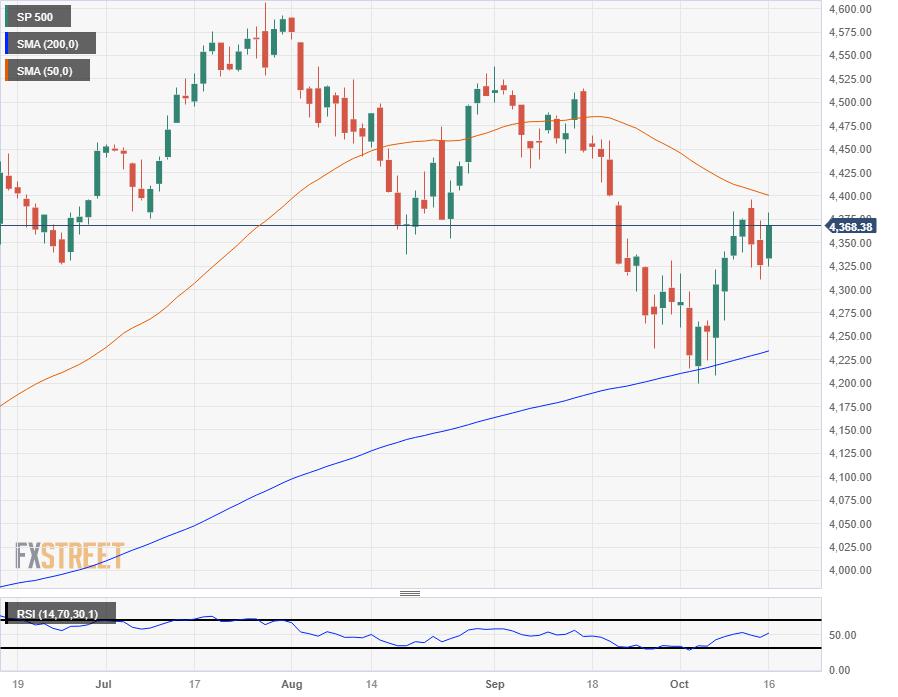
The S&P 500's Monday rebound takes the index into $4,370 to close out the day after marking in an intraday high of $4,381. Monday's recovery sees the major equity index back into the green, but still down from Thursday's peak near $4,396.
Current price action is set to see technical resistance coming from the 50-day Simple Moving Average (SMA) which is testing into the $4,400 major handle, but long-term prospects appear to remain bullish after the S&P decisive rebound from the 200-day SMA near $4,225 in early October.
S&P 500 Daily Chart
S&P 500 Technical Levels
Reprinted from FXStreet_id,the copyright all reserved by the original author.
Disclaimer: The content above represents only the views of the author or guest. It does not represent any views or positions of FOLLOWME and does not mean that FOLLOWME agrees with its statement or description, nor does it constitute any investment advice. For all actions taken by visitors based on information provided by the FOLLOWME community, the community does not assume any form of liability unless otherwise expressly promised in writing.
FOLLOWME Trading Community Website: https://www.followme.com


Hot
No comment on record. Start new comment.